Spatial and Temporal Summation
Jim Hutchins
Objective 8: State the principles underlying spatial and temporal summation of graded potentials.
How to Decide When You’re a Neuron
Each of the 10,000 inputs onto a neuron is weighted differently.
Each neuron has at least one decision point where the neuron asks itself: Do I fire an action potential, or not? Do I release neurotransmitter, or not?
From the perspective of the decision point, the sum total of the weighted inputs either results in a voltage above threshold, or it doesn’t. That is how the question is answered. At this location, is my membrane voltage above threshold, or not? If it is, then an action potential is generated at the axon hillock. If it is, then neurotransmitter is released from the active zone of a synapse.
Graded Potentials
Each EPSP and IPSP in a neuron is termed a graded potential. (Remember that “potential” and “voltage” are the same thing.) As we saw in Objective 6, graded potentials decrement in space following mathematical rules that are invariant. The larger the distance between the source of the voltage change and the decision point (i.e. the more length constants the graded potential has to traverse), the smaller the voltage change becomes. The more time that passes after the voltage change, the smaller the voltage change becomes.
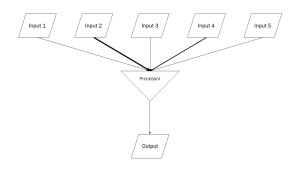 In this diagram, which is deliberately designed as a computer flowchart, with standardized symbols: a parallelogram for inputs (postsynaptic potentials) and a triangle for a merge point. This represents where the dendritic spines receive EPSPs or IPSPs, which then pass into small dendritic branches that come together at a single point. Note the weight of the arrow is different, because PSPs come in different sizes, and different dendritic branches have different calibers and therefore different length and time constants. The EPSPs and IPSPs are all summed together depending on their size and direction at the branch point (triangle in this diagram). This becomes the output of this system of branches.
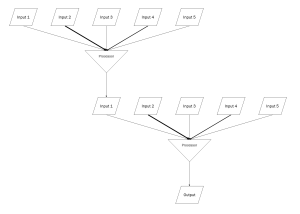
 Imagine that five of these tiny branches gather together into the next branch point. Only one is shown, but you can see that the output (summed voltage) of each branch point (1, 2, 3, 4, 5) becomes the input voltage of the new branch point. This continues, with each dendritic tree, until finally the ultimate output (potential, voltage) reaches a decision point and threshold is reached — or not.
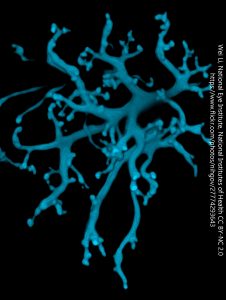
To help you visualize this branching, imagine EPSPs and IPSPs coming in at each of the dendritic spines (bumpy shapes) on this retinal bipolar cell. Then imagine the voltages summing together at each branch point, and that summed voltage moving forward to the next branch point, and so on.
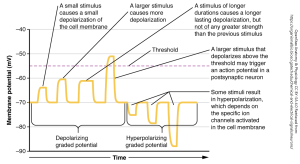 Because graded potentials come in different sizes, as shown here, they can be summed together over distance and in time. Imagine what happens to each of the PSPs shown as they travel over distance, or as time passes.
Spatial Summation
 The closer a postsynaptic potential is to the decision point, the greater the influence it has on the eventual decision being made. This concept is called spatial summation. A superthreshold postsynaptic potential which is right next to the active zone of a synapse almost certainly will cause neurotransmitter to be released. An input to a projection neuron at the axon hillock, if large enough to open enough voltage-gated Na+ channels, will almost certainly cause an action potential to be generated.
Temporal Summation
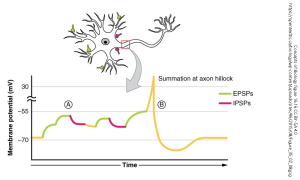
The more closely postsynaptic potentials are spaced in time, the larger the eventual sum when they are added together. This concept is called temporal summation. Many small EPSPs all arriving at a decision point at the same time will be likely to result in a superthreshold stimulus. If, as shown in the diagram, there is 15 mV between the resting potential and the threshold, then sixteen 1 mV stimuli all arriving at the same time will result in an action potential. If, however, there is a 1 msec space between each, then each one will decrement in time and the chance of triggering an action potential is now quite small.
Visualizing Temporal and Spatial Summation
The video above will be used to explain the concept of spatial and temporal summation. Start the video, then pause at about 0:08. Note the legend on the heat map: cooler colors are closer to resting potential for this neuron, while hotter colors are closer to threshold.
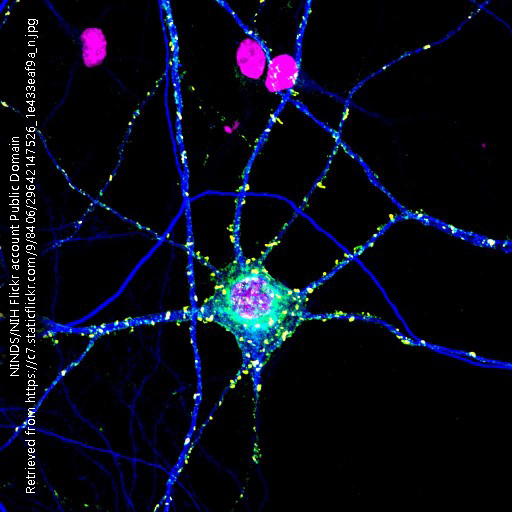
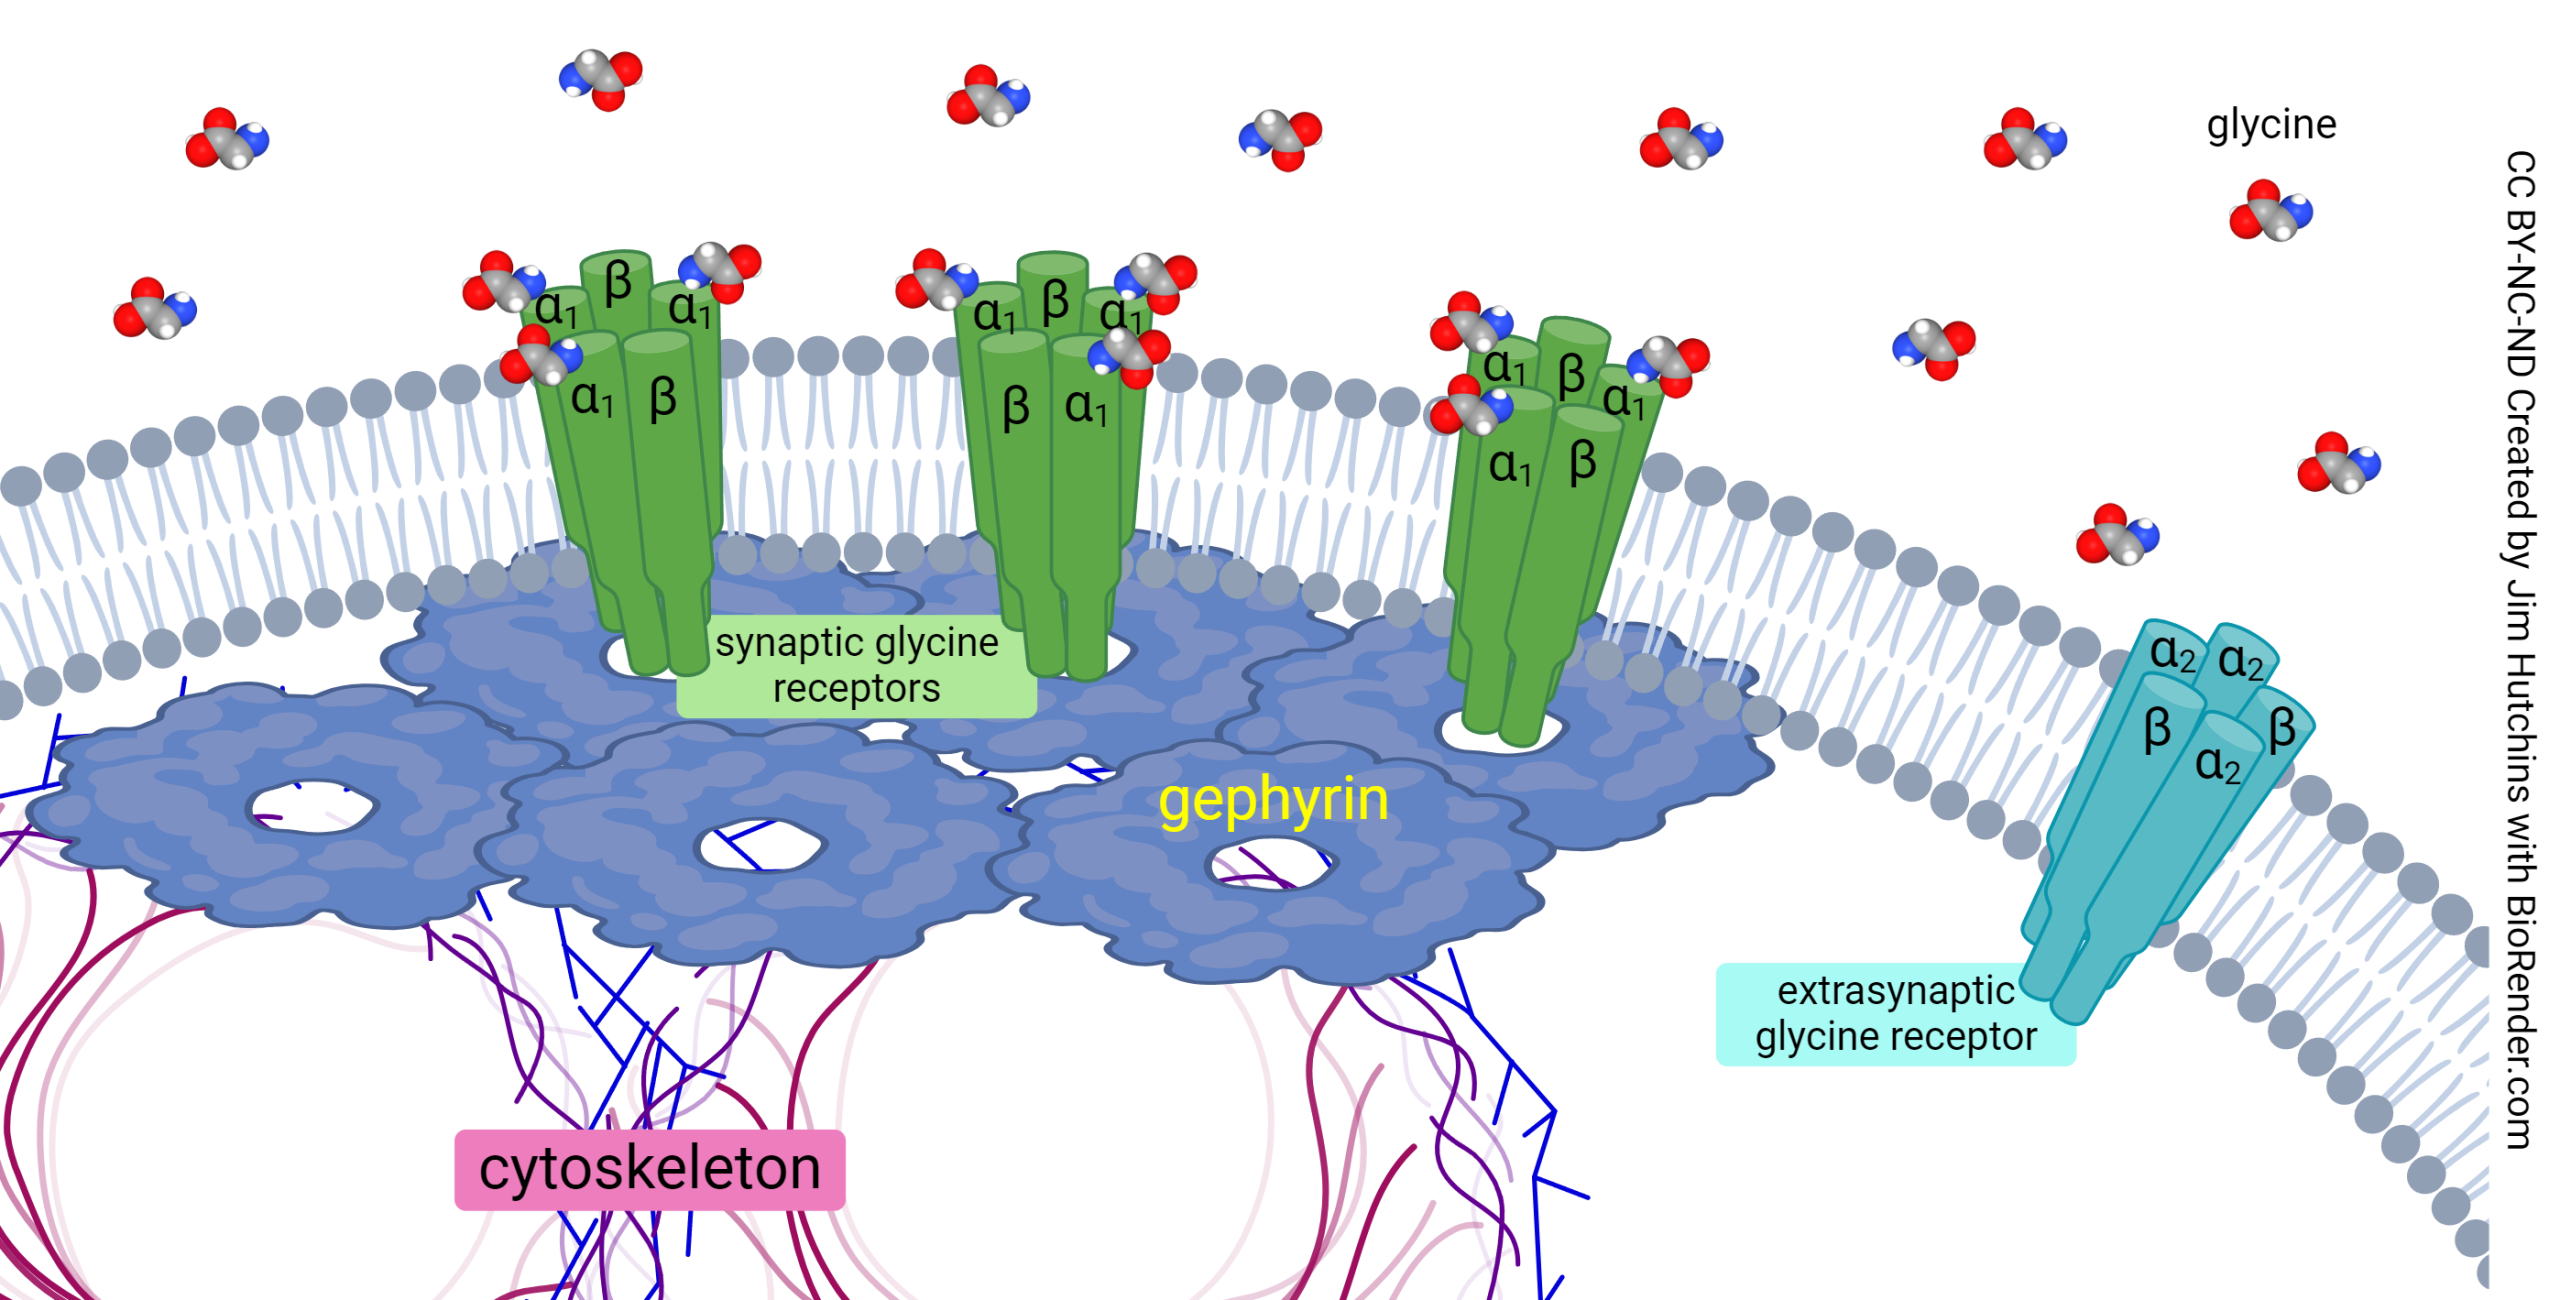
Now look at the diagram at right. Imagine you are inside the dendrite of a neuron, looking up at the neuronal surface. Either you have developed the ability to ‘see’ voltage, or someone has filled the dendrite with voltage-sensitive dye. Right in front of you, just above the horizon, you are looking at a receptor scaffolding complex. There are so many positive ions flowing in at this point, they turn your thermal map green, indicating a ‘hot spot’ of voltage change.
Right in front of you, just above the horizon, you are looking at a receptor scaffolding complex. There are so many positive ions flowing in at this point, they turn your thermal map green, indicating a “hot spot” of voltage change.Elsewhere, there are clusters of neurotransmitter receptors that allow positive ions to flow in, resulting in warmer colors.
As the ions stream in, they change the color of the dye, reflecting a more positive voltage right next to where ionotropic receptors are located.
Watch one of the streams as it travels from right to left. It eventually disappears in the lower-voltage regions of the dendrite. Near where several streams come together, the voltage remains consistently higher. This is spatial summation in action. The voltage of graded potentials decreases steadily with distance. If several graded potentials are spaced closer together, they have more of an influence on the local voltage.
If you see a “burst” of color, then follow it over time. Note that as time passes in the video, the warmer colors dissipate and turn into the cooler colors, indicating a return to rest. This is temporal summation. The voltage of graded potentials decreases steadily with time. We call this steady decrease a decrement.
This situation with voltages decrementing in space and time is analogous to how temperatures mix in flowing water. In the original film, kindly given to me by Dr Martin Briggs of the US Geological Survey, we are seeing warmer water at upper right seeping into a body of water where a discharge of cold water is mixing with the warmer water surrounding it.
Literature Cited
Briggs, M.A., Jackson, K.E., Liu, F., Moore, E.M., Bisson, A., and Helton, A.M., 2022, Exploring Local Riverbank Sediment Controls on the Occurrence of Preferential Groundwater Discharge Points: Water, v. 14, no. 1, 11 p., https://doi.org/10.3390/w14010011
Moore, E.M., Jackson, K.E., Haynes, A.B., Harvey, M., Helton, A.M., and Briggs, M.A., 2023, Thermal infrared images of groundwater discharge zones in the Farmington and Housatonic River watersheds (Connecticut and Massachusetts, 2019) (ver. 3.0, January 2023): U.S. Geological Survey data release, https://doi.org/10.5066/P915E8JY
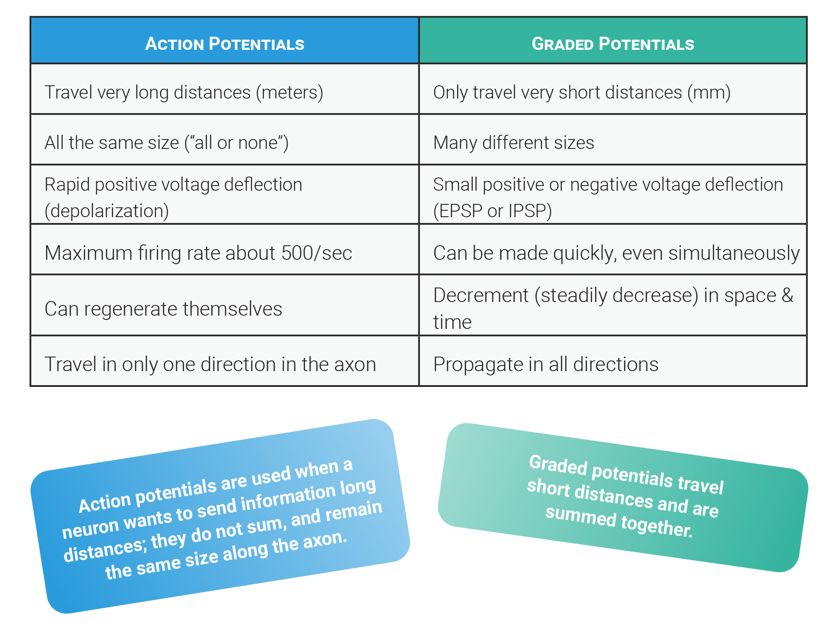
Compare and Contrast: Action Potentials and Graded Potentials
Media Attributions
- U13-031-action-potential
- Information flow in neurons © Jim Hutchins is licensed under a CC BY-SA (Attribution ShareAlike) license
- Information flow in neurons © Jim Hutchins is licensed under a CC BY-SA (Attribution ShareAlike) license
- Bipolar cell dendrites © Wei Li, National Eye Institute, National Institutes of Health is licensed under a CC BY-NC (Attribution NonCommercial) license
- Summation in a neuron © Betts, J. Gordon; Young, Kelly A.; Wise, James A.; Johnson, Eddie; Poe, Brandon; Kruse, Dean H. Korol, Oksana; Johnson, Jody E.; Womble, Mark & DeSaix, Peter is licensed under a CC BY (Attribution) license
- Summing together in a neuron © Betts, J. Gordon; Young, Kelly A.; Wise, James A.; Johnson, Eddie; Poe, Brandon; Kruse, Dean H. Korol, Oksana; Johnson, Jody E.; Womble, Mark & DeSaix, Peter is licensed under a CC BY-SA (Attribution ShareAlike) license
- Anchoring-of-the-glycine-receptor-at-the-synapse-scaled-1 © Jim Hutchins | BioRender is licensed under a CC BY-NC-ND (Attribution NonCommercial NoDerivatives) license
- U13-033-rising-phase-of-action-potential-1-scaled-1
About the author

Dr. Jim Hutchins is an adjunct instructor at Colorado School of Mines with 45 years of teaching experience spanning K-12 through medical school. He earned his PhD in Neuroscience from Baylor College of Medicine, where his dissertation focused on acetylcholine as a neurotransmitter in the human retina, followed by postdoctoral research at Vanderbilt University on visual system development. His research contributions include highly cited work on mitochondrial superoxide dismutase and synaptic pruning in the retinogeniculate system. Dr. Hutchins has authored multiple open-access textbooks in neuroscience, medical terminology, and anatomy & physiology, creating freely accessible educational resources that have saved students over $5 million in textbook costs. He is committed to open educational resources and Creative Commons licensing, believing that knowledge should be freely available to all learners.
