9 Datums and Coordinate Systems
It is easy to think of the Earth as a perfect sphere, however, to create accurate maps, we must consider how the spherical Earth is converted to a flat map, the components needed to do so, and how projections affect the feature representation. This chapter introduces the projection components that produce two-dimensional maps from three-dimensional surfaces and the basics of the Earth’s coordinate systems.
Topics covered include:
- Geodesy – the Earth’s shape and the relative approximations for defining the shape
- Datums – how datums are used with map projections, common datums used, and datum transformation
- Coordinate Systems – this section explains geographic and projected coordinate systems
By the end of this chapter, you should understand the basic shapes of the Earth, how datums are used with coordinate systems, and how different coordinate systems impact location representation.
Introduction was authored by students in GEOG 3053 GIS Mapping, Spring 2024 at CU-Boulder: John Davis, Grady Forsyth, Kevin Frame, Beckett Gonzales, Emily Leahy, Kieran Stone, and one anonymous student.
9.0 What is Geodesy?
Geodesy is the scientific discipline that deals with the measurement representation of the Earth. Geodesists study the Earth’s gravitational field, its geometry, the motion of the Earth’s crust, tides, and the Earth’s rotation.
The Earth’s Shape: There are three commonly used approximations of the shape of the Earth: sphere, ellipsoid, and geoid. The sphere is the simplest approximation of the Earth’s shape as it is defined by a single radius with all points on the sphere’s surface being equidistant from the center point. The ellipsoid is closer to the Earth’s shape as defined by semi-major and semi-minor axes, with one axis being slightly longer than the other. The geoid is the closest approximation of the Earth’s shape based on gravity measurements (Figure 9.0) [4]. It is an uneven surface that approximates the mean sea level across the Earth’s surface by taking gravitational forces into account [2]. The sphere and ellipsoid are still used most often in mapping as they are much easier to apply to projection calculations and, when defined properly, can be exceptionally accurate [4].
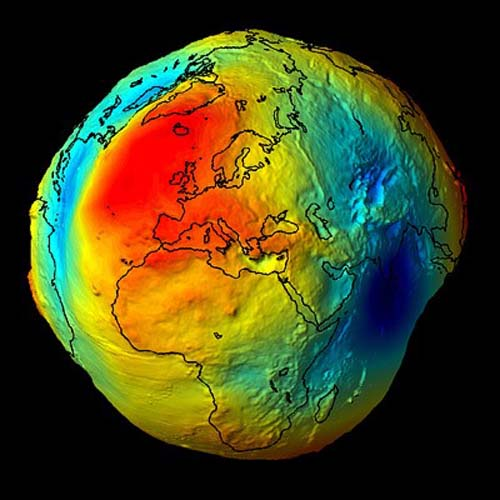
Figure 9.0. Exaggartation of the Earth’s Geoid.
Credit: The Earth’s gravity field (geoid), European Space Agency, public domain
Ellipsoids: Due to the centrifugal force created by the Earth’s rotation, the Earth bulges slightly at the center—it is wider around the equator than from pole to pole. Because of this, a better way to describe Earth’s shape is as an ellipsoid. Ellipsoids that closely resemble spheres are often called spheroids (Figure 9.1) [2].
The ellipsoid is the most commonly used of the three approximations of the Earth’s shape today. There is not a single ellipsoid that fits Earth well; therefore, there are many official ellipsoids. Different ellipsoids were adopted because different measurements were used in different countries when defining these ellipsoids. Therefore, an ellipsoid created by one country may approximate that portion of the Earth very well, but may not be a suitable approximation for another portion of the Earth [4].
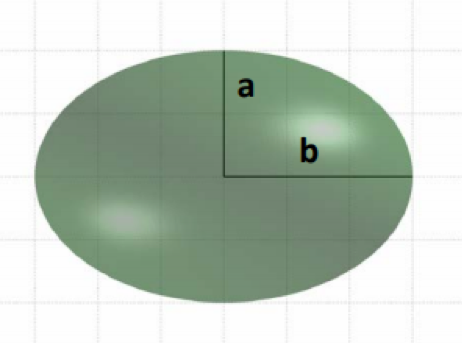
Figure 9.1. An exaggerated example of a spheroid.
Credit: oblate spheroid, USGS, public domain
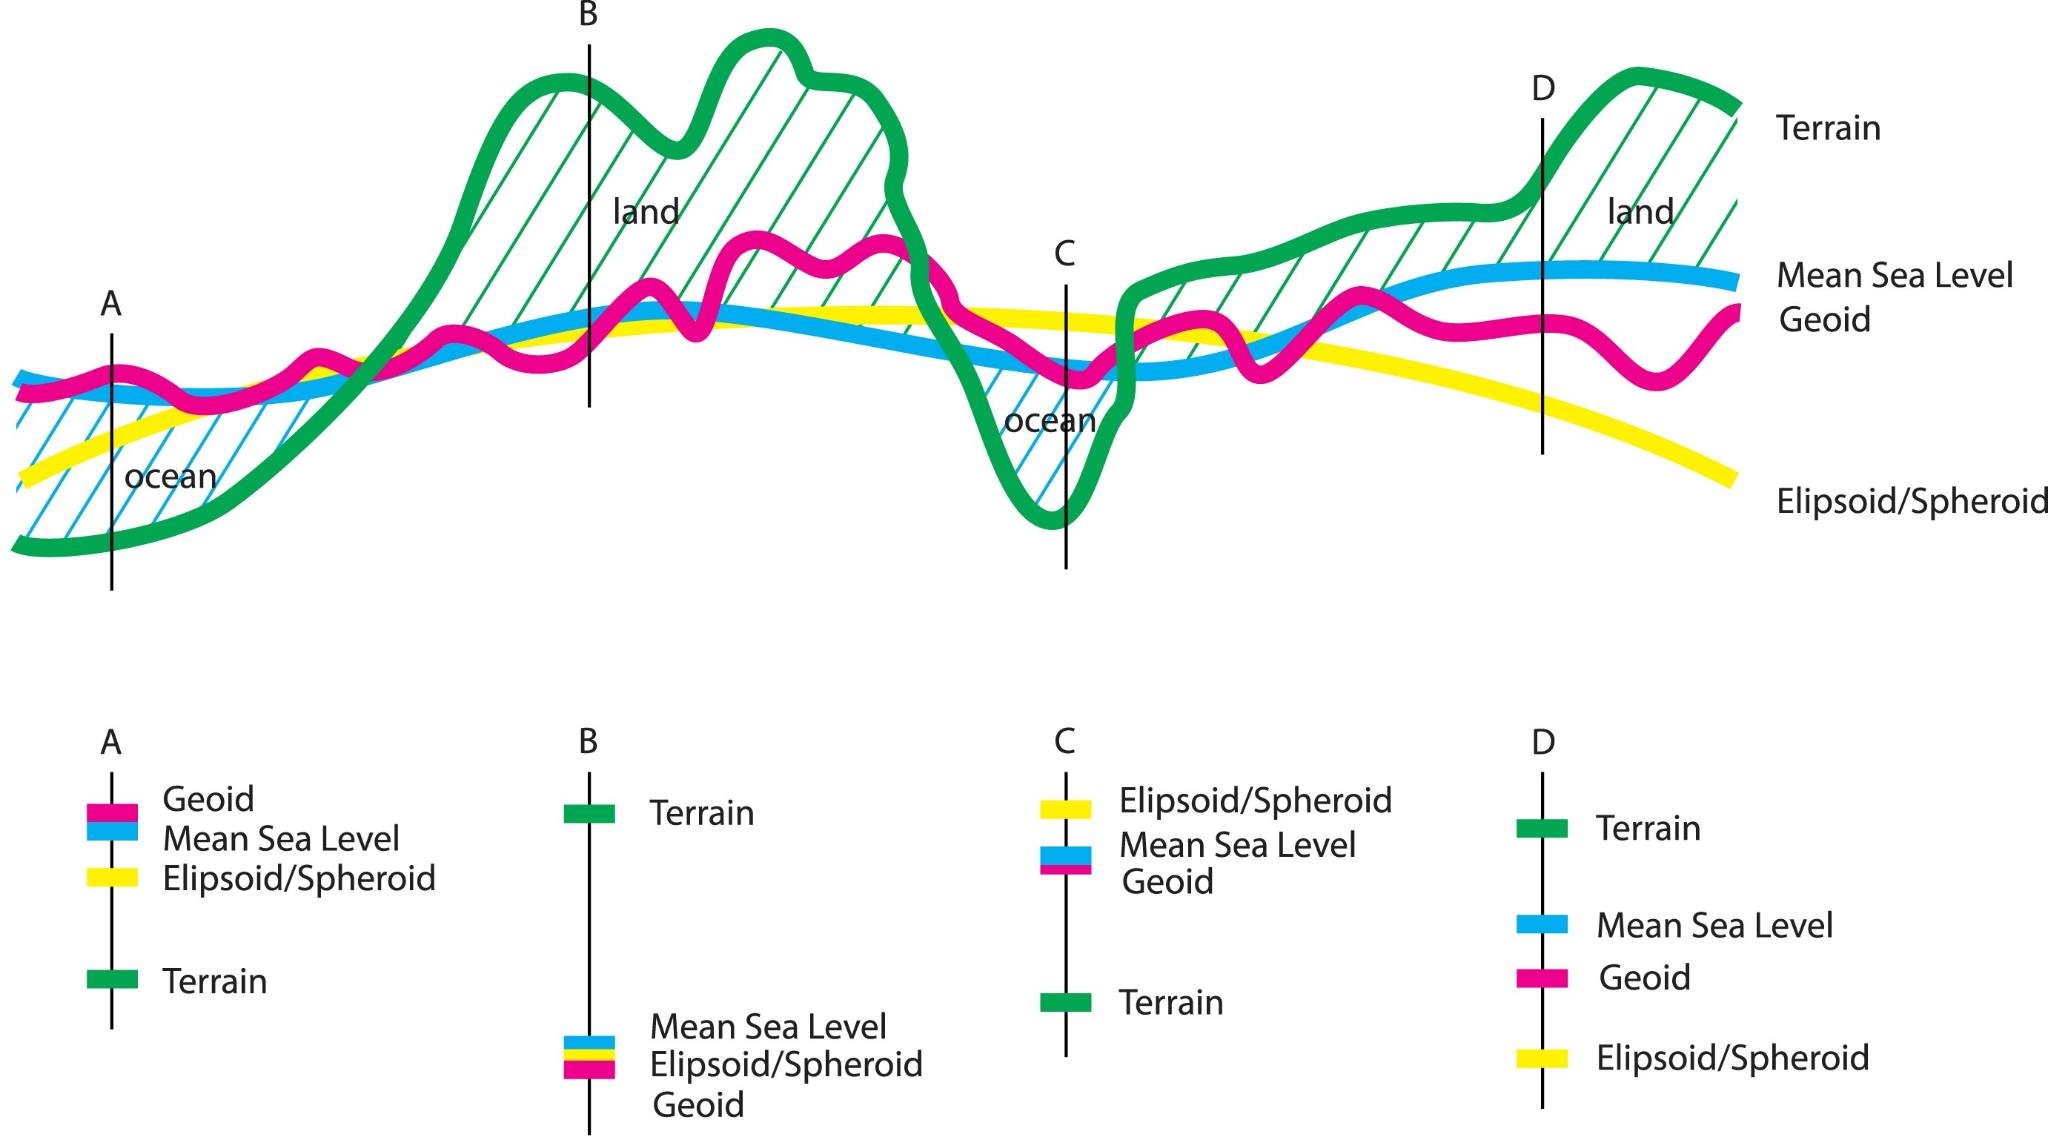
Figure 9.2. Comparison of the Earth’s mean sea level, surface terrain, geoid and ellipsoid/spheroid.
Credit Image from Intergovernmental Committee on Surveying and Mapping, Australia, CC BY 3.0
9.1 Datums
There are three common datums used in North America: North American datum of 1927 (NAD 27), North America datum of 1983 (NAD 83), and World Geodetic System of 1984 (WGS 84).
According to the National Geodetic Survey [oepns in new tab], a datum is a set of constants specifying the coordinate system used for calculating the coordinates of points on Earth [4]. A datum specifies precisely the orientation and origins of the lines of latitude and longitude relative to the center of the Earth, a spheroid, or an ellipsoid [3]. We cannot assign any coordinates to a location without first specifying a datum and linking that datum to the shape of the Earth through field measurements [4].
NAD 27: The North American Datum of 1927 (NAD 27) is based on the Clarke 1866 ellipsoid which holds a fixed latitude and longitude in Meade’s Ranch, Kansas. The locations were adjusted based on about 26,000 measurements across North America.
NAD 83: The North American Datum of 1980 (NAD83) is the modernized replacement of NAD27 and sought to improve positional accuracy as a result of adding thousands of new benchmarks [2]. It uses an Earth-centered reference ellipsoid rather than a fixed station (Figure 9.3). Additionally, 250,000 points were measured to adjust the latitude and longitude locations for improved accuracy [4].
WGS 84: The World Geodetic System of 1984 (WGS 84) is based on satellite measurements and the WGS 84 ellipsoid [4]. Because the datum uses the Earth’s center as its origin, locational measurements tend to be more consistent regardless of where they are obtained. However, they may be less accurate than those returned by a local datum. Switching between datums will alter the coordinates (i.e., latitude and longitude) for all locations of interest and a datum transformation may be needed [3]. It is also important to note that the WGS 84 datum is used by Global Positioning Systems (GPS) to report latitudes and longitudes [4].
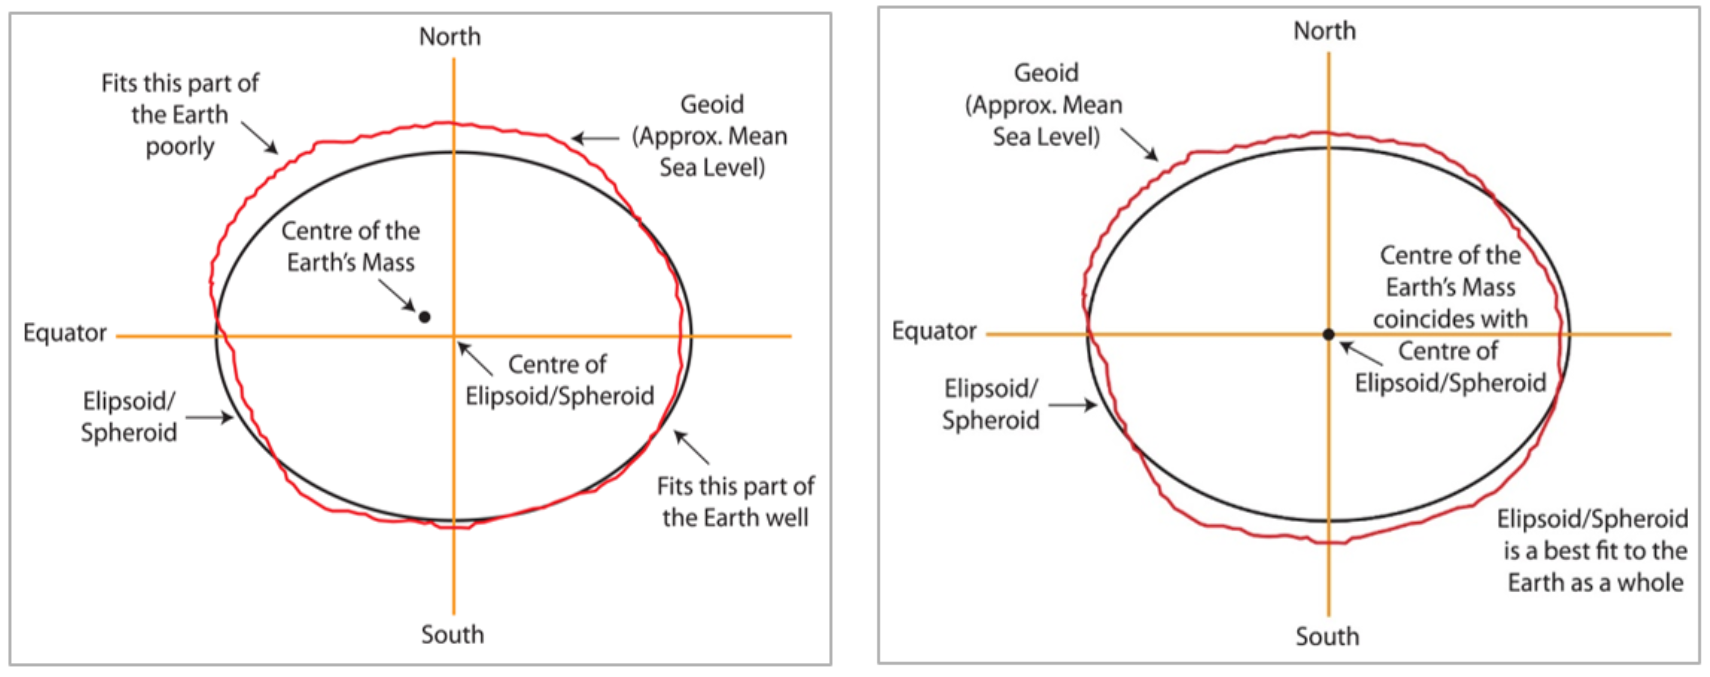
Figure 9.3. Australian Geodetic Datum (AGD84) (left), and the Geocentric Datum of Australia (GDA94) (right).
Credit: Image from Intergovernmental Committee on Surveying and Mapping, Australia, CC BY 3.0
Datum Transformation: Datum transformation is the process of re-calculating locations based on a different datum and may be necessary if you are combining datasets that were specified using different datums (e.g., NAD27 vs. NAD83), or if you would like to map historical data using a more up-to-date system [4].
9.2 Coordinate Systems
Geographic Coordinate System (GCS): Coordinate systems are frameworks that are used to define unique positions. The coordinate system that is most commonly used to define locations on the three-dimensional Earth is called the geographic coordinate system (GCS), and it is based on a sphere or spheroid. A spheroid is simply a sphere that is slightly wider than it is tall and approximates more closely the true shape of the Earth [1].
The unit of measurement in the GCS is degrees, and locations are defined by their respective latitude and longitude within the GCS. Latitude is measured relative to the equator at zero degrees, with maxima of either ninety degrees north at the North Pole or ninety degrees south at the South Pole. Longitude is measured relative to the prime meridian at zero degrees, with maxima of 180 degrees west or 180 degrees east [1].
Note that latitude and longitude can be expressed in degrees-minutes-seconds (DMS) or in decimal degrees (DD) (Figure 9.4). When using decimal degrees, latitudes above the equator and longitudes east of the prime meridian are positive, and latitudes below the equator and longitudes west of the prime meridian are negative [1].
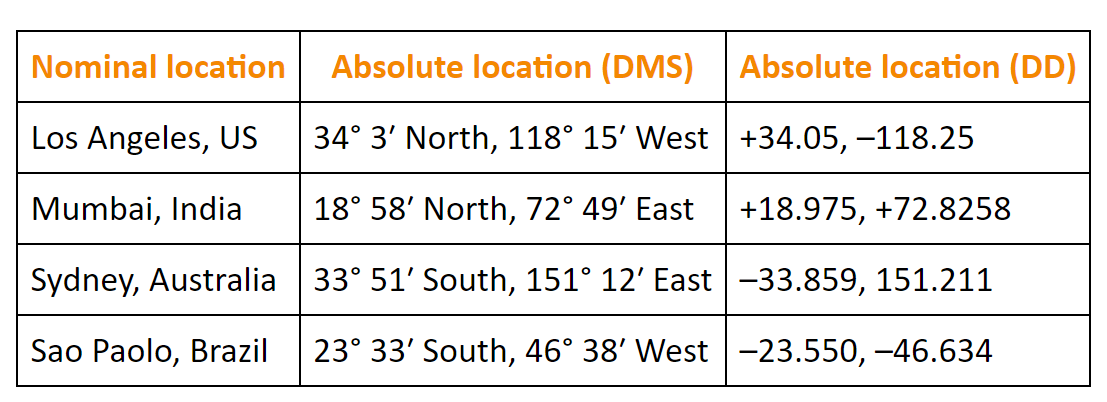
Table 9.4. Example geographic coordinates in DMS and DD.
Credit: Table from Essentials of Geographic Information Systems, Campbell and Shin, CC BY-NC-SA 3.0
Longitude: Longitude is the angle of rotation measured east and west around the globe with the lines of longitude, also known as Meridians, running north-south from the North Pole to the South Pole. Lines of longitude will vary from positive 180° east to -180° west measured relative to the line of longitude of 0° which is known as the Prime Meridian, which runs through Greenwich, England. Lines of longitude west of the Prime Meridian up to and including 180° are represented as a negative number or as a Western longitude. Lines of longitude east of the Prime Meridian up to, and including 180°, are represented as a positive number or as an Eastern longitude [4].
Latitude: The second angle of rotation is known as latitude and the lines of latitude are referred to as parallels. Parallels measure north to south on the globe, and the lines run in parallel to each other from the North Pole to the South Pole. The equator is the latitude of 0°. Lines of latitude measure from positive 90° north, which is located at the North Pole, to -90° south, which is located at the South Pole [4].
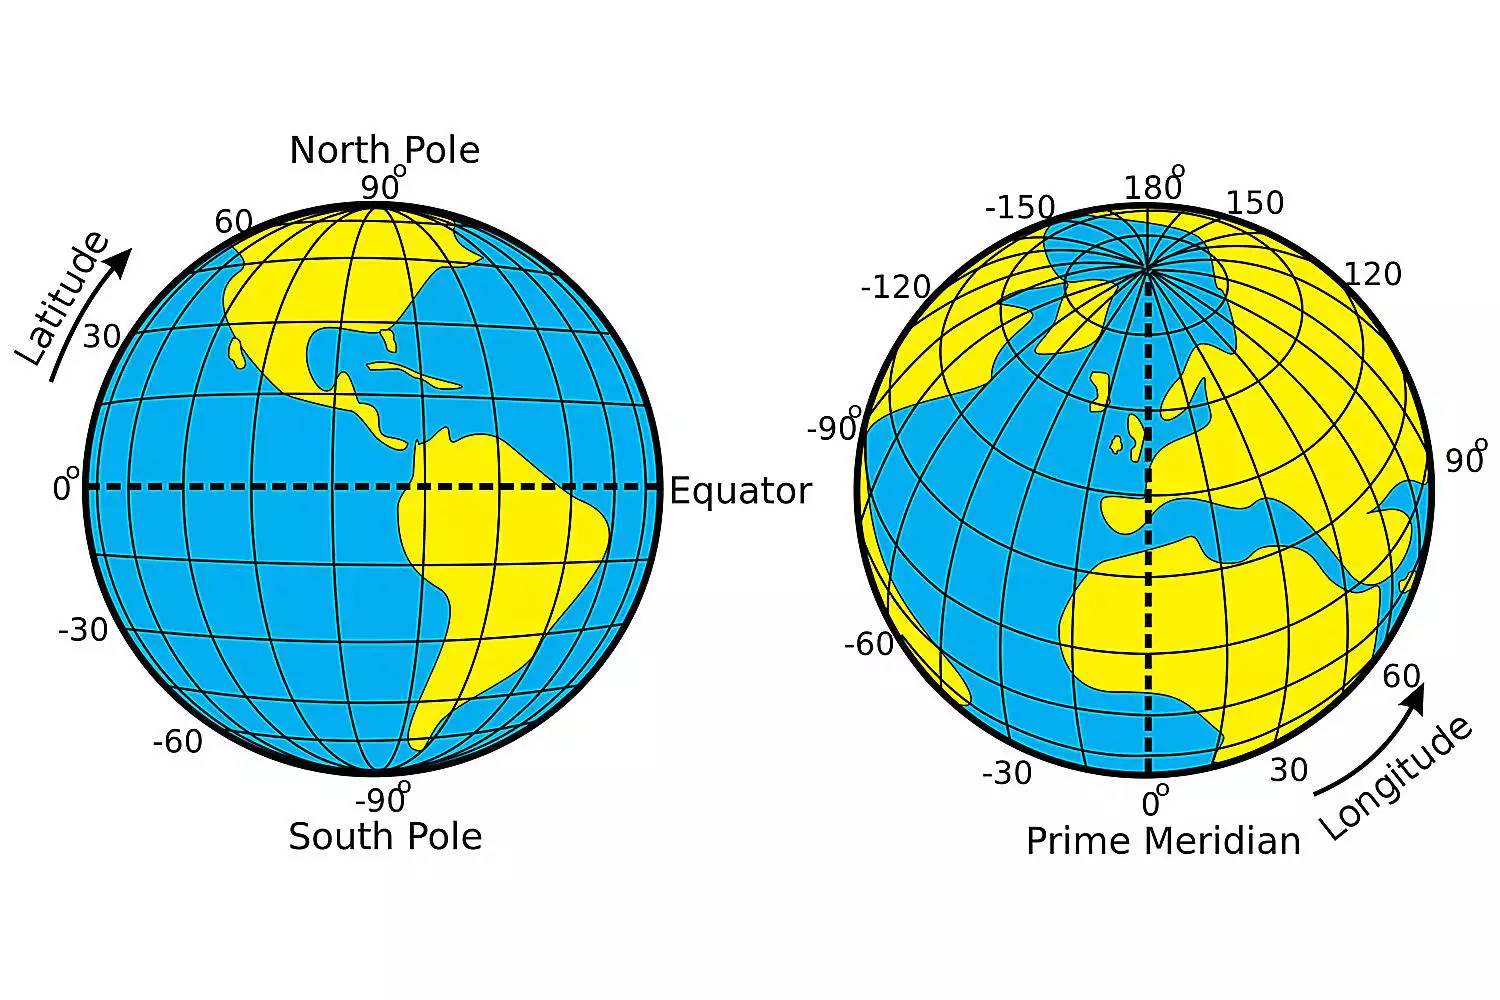
Figure 9.5 Latitude and Longitude.
Credit: Latitude and Longitude of the Earth, Wikimedia Commons, Djexplo, CC0 1.0
2D Coordinate Systems: A 2-D Cartesian coordinate system, also referred to as a Projected Coordinate System (PCS) in some GIS software, can represent many possible locations at many possible scales. The two most common representations that are widely used in North America are the State Plane Coordinate System (SPCS) and the Universal Transverse Mercator Coordinate System (UTM) [4].
State Plane: The state plane coordinate system is a set of 126 geographic zones that cover the United States of America. Each zone is designed specifically for a particular region that allows for simple calculations and is reasonably accurate within each zone. In the SPCS coordinates are always positive inside each zone. The SPCS can be based on NAD 27 or NAD 83 datums, and the coordinates are represented and measured in feet [4].
Each state may have multiple state plane zones with each zone strategically placed to minimize the amount of error within each zone. Additionally, each zone provides a common coordinate reference for horizontal coordinates. Depending on the shape of the state, the state plane zone can be based on two types of map projections, the Lambert Conformal Conic, or the Transverse Mercator (see Section 9.3 for more information on projections) [4].
Figure 9.6 shows the state plane zones in the 48 lower contiguous states of the United States of America. Notice that most states have multiple zones and that zones typically either run north to south, or east to west. Also note that most of the smaller states, particularly in the New England area, only have one state plane zone covering the entire state, while larger states such as California and Texas, have multiple zones so that the error can be minimized throughout the state. There are notable exceptions to this such as Montana, Nebraska, and Tennessee. State plane zones are typically designated with the name of the state followed by a section indicator, such as North, Central, and South, or a combination of those, or, West, Central, and East. An exception to this is California which specifies each zone using a different number [4].
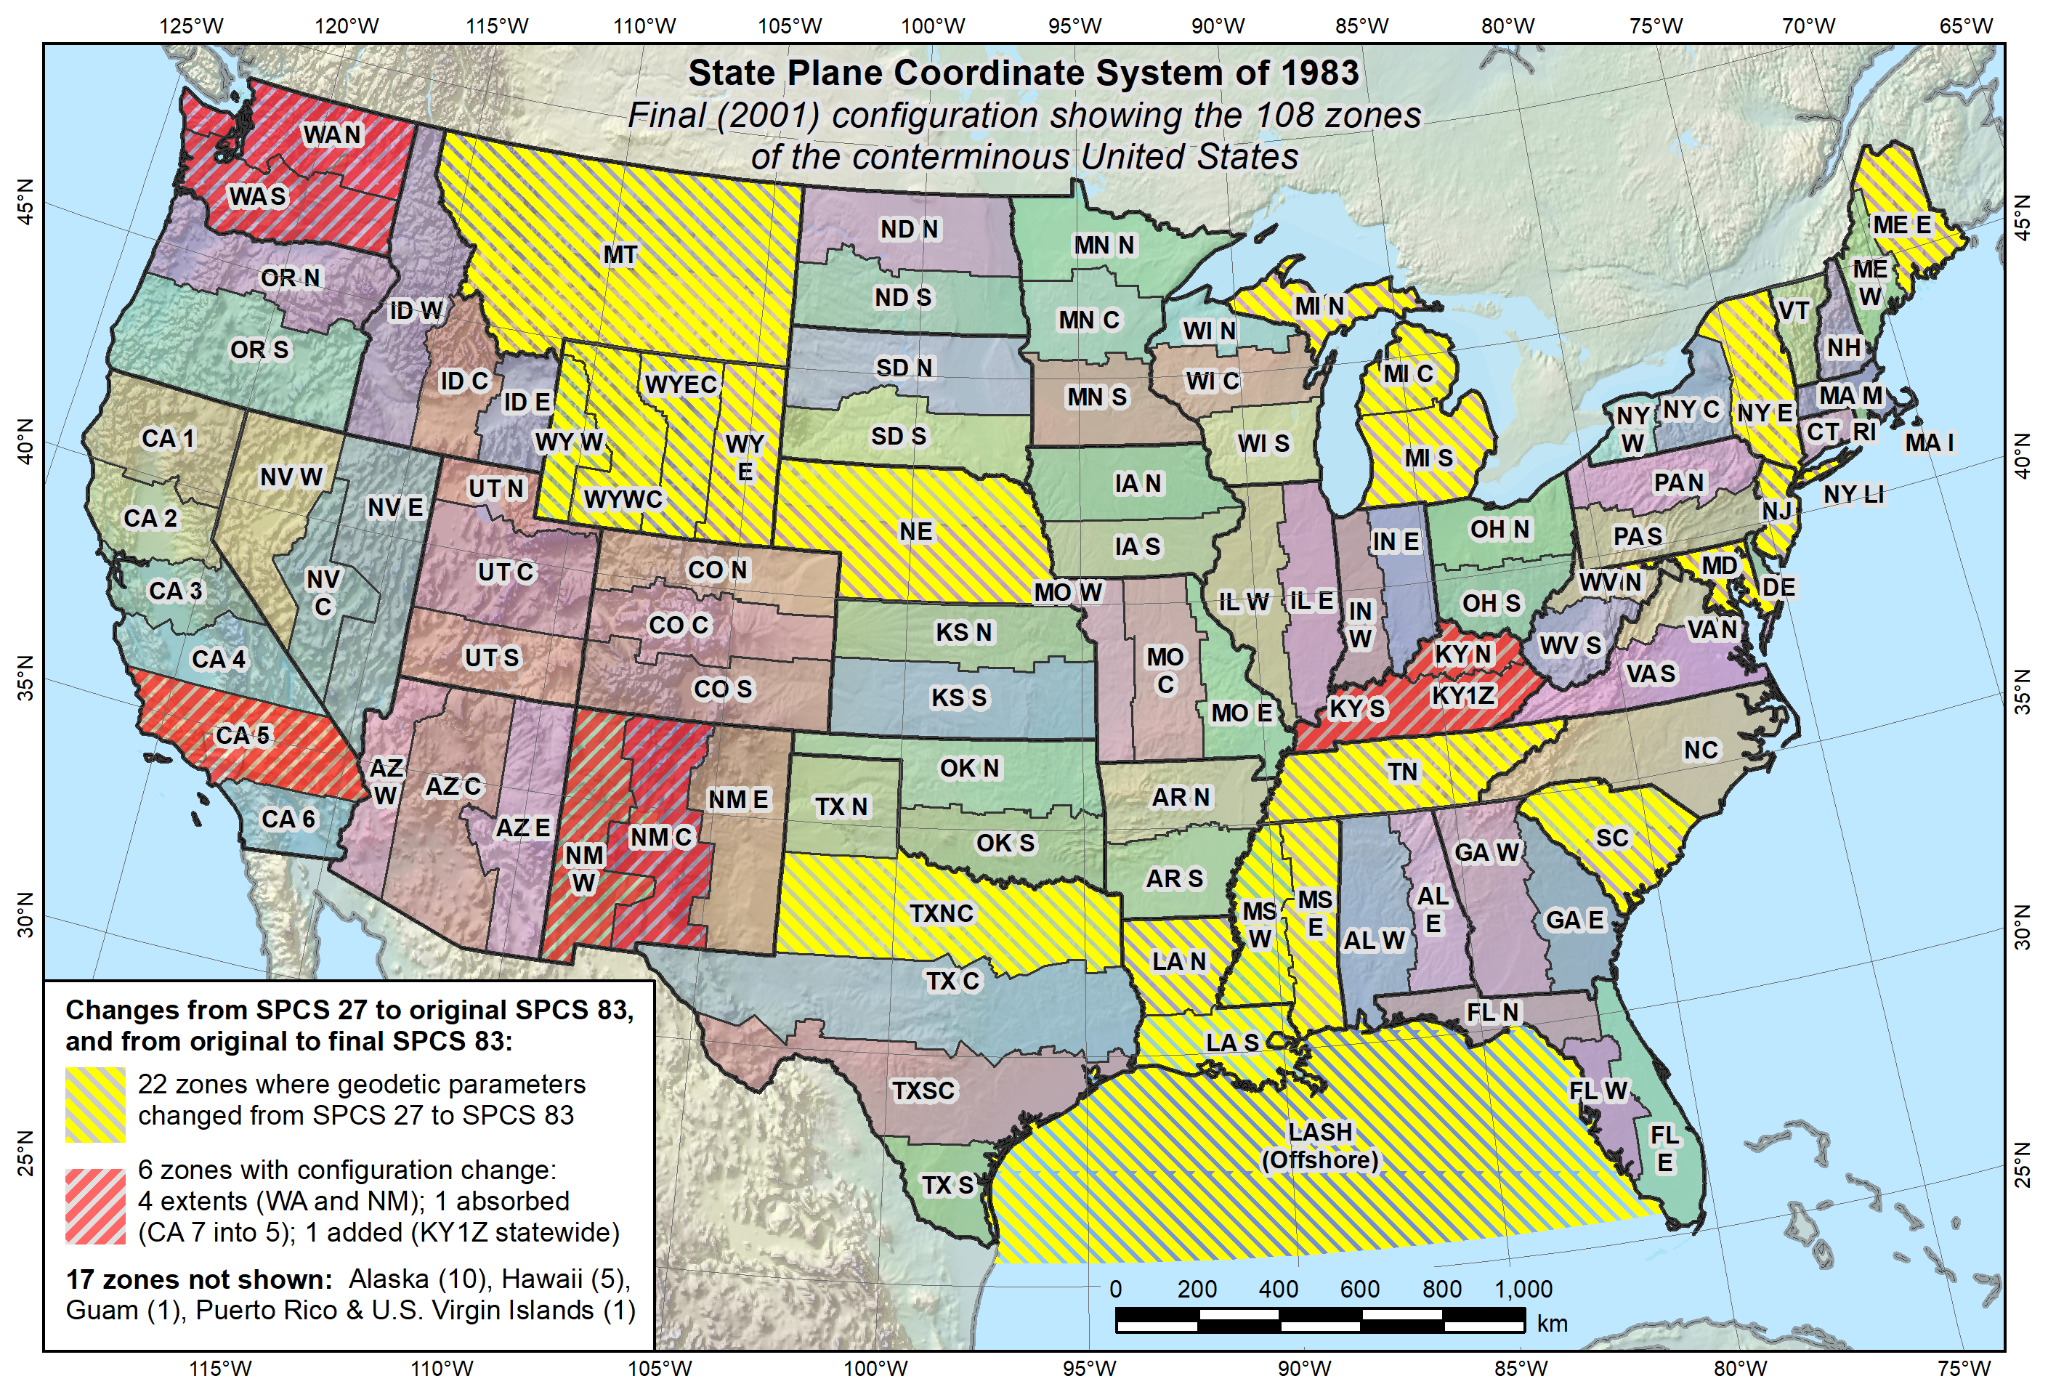
Figure 9.6. State Plane Coordinate System Zones.
Credit: Final SPCS 83 (as of 2001), National Geodetic Survey, public domain
Universal Transverse Mercator (UTM) Coordinate System: The UTM Coordinate System (UTMCS) is a worldwide 2-D coordinate system that splits the world into 60 zones. This system is useful because it provides for simple calculations and manages errors within each zone. Unlike the SPCS which is measured in feet, the UTM coordinate system is specified and measured in meters (cartography). In the UTM coordinate system, the Earth’s surface is divided in rectangular regions, and for each of them, a different projection and a different set of geodetical parameters are used. It uses a single ellipsoid, WGS-84 [5], and a single projection, the Transerve Mercator (see Section 9.3 for more information on projections).
The UTM grid contains 60 zones, each covering 6° of longitude in width at the equator. Each zone is also segmented into 20 latitude bands, ranging from 80° South to 84° North (see Jaworski [opens in new tab] for a map of the UTM zones). To avoid negative coordinate numbers, the origin is assumed to have an X coordinate of 500,000 meters and a Y coordinate of 10,000,000 meters, causing all coordinates referred to it to have only positive values [5] which are referred to as false eastings and false northings, respectively. The remaining 6° north and 10° north are covered by a different coordinate system, the Universal Polar Stereographic (UPS) coordinate system. See Figure 9.7 for a map of the UTM Zones of the contiguous United States.
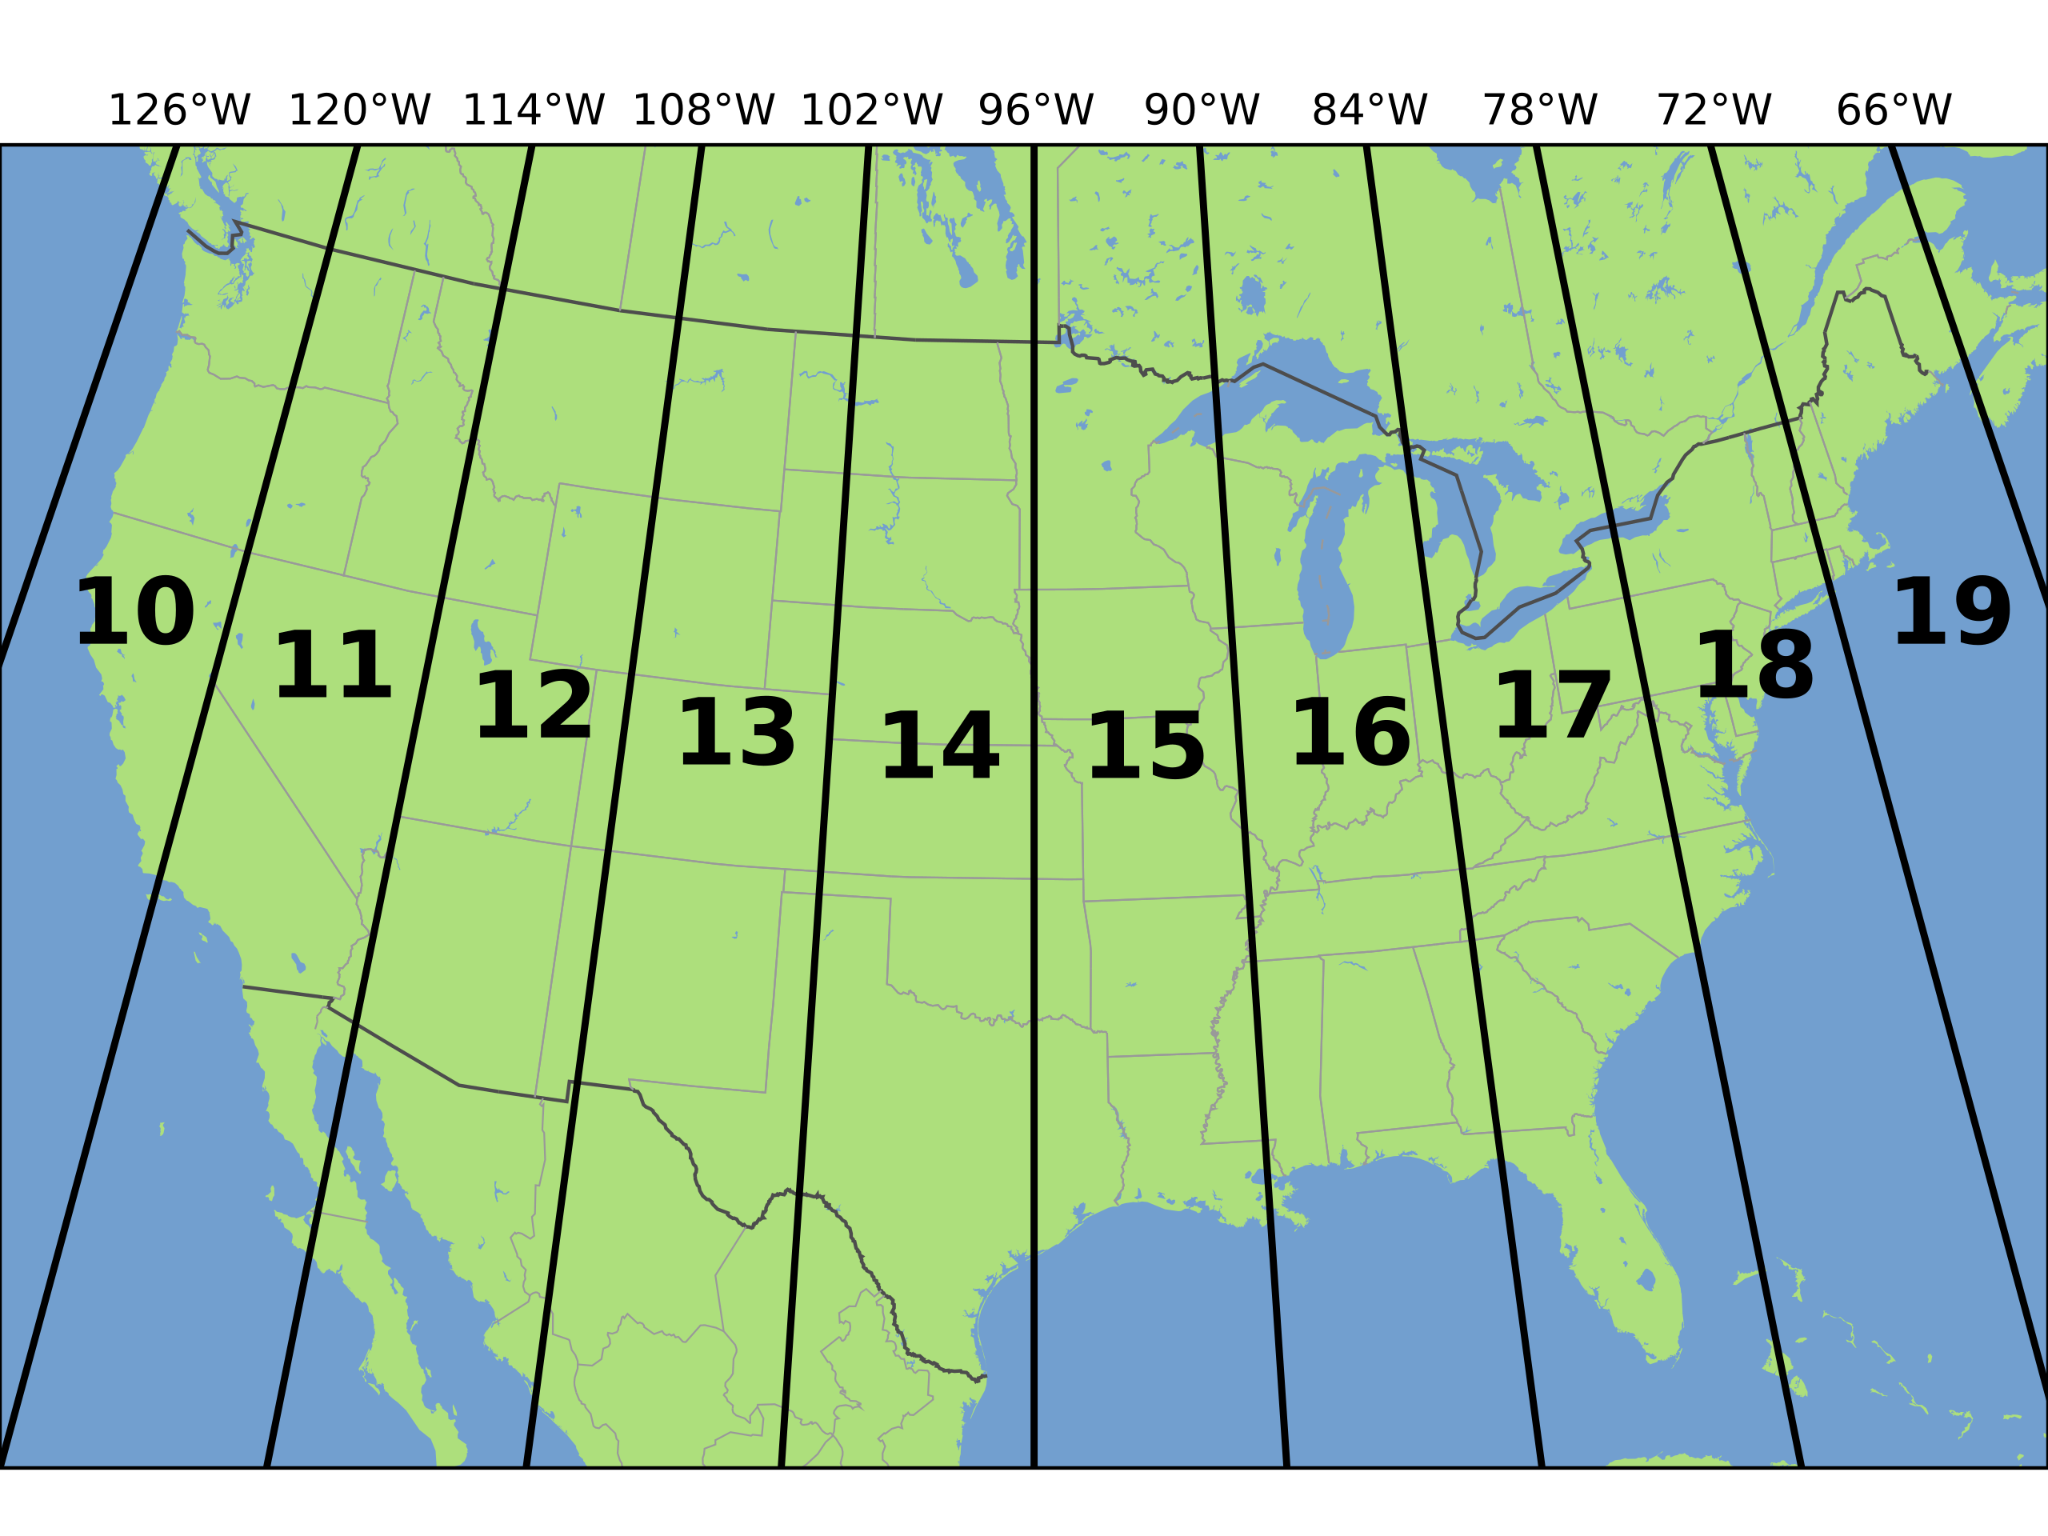
Figure 9.7. UTM Coordinate System Zones for the contiguous United States.
Credit: UTM zones USA, Wikipedia, Chrismurf, CC BY 3.0
9.3 Projection Concepts
Defined, a map projection is a systematic rendering of locations from the curved Earth surface onto a flat map surface. This allows us to flatten the curved surface onto a flat surface such as a piece of paper, or a computer screen. A map projection is broadly composed of three parts, the ellipsoid (see section 9.0), which models the shape of the Earth, a light source which is used to project features on the Earth’s surface, and a developable surface commonly a flat piece of paper onto which the Earth’s features are projected, and flattened to be used as a map [4].
To illustrate the concept of a map projection, imagine that we place a light bulb in the center of a translucent globe (Figure 9.8). On the globe are outlines of the continents and the lines of longitude and latitude called the graticule. When we turn the light bulb on, the outline of the continents and the graticule will be “projected” as shadows on the wall, ceiling, or any other nearby surface. This is what is meant by map “projection” [1].
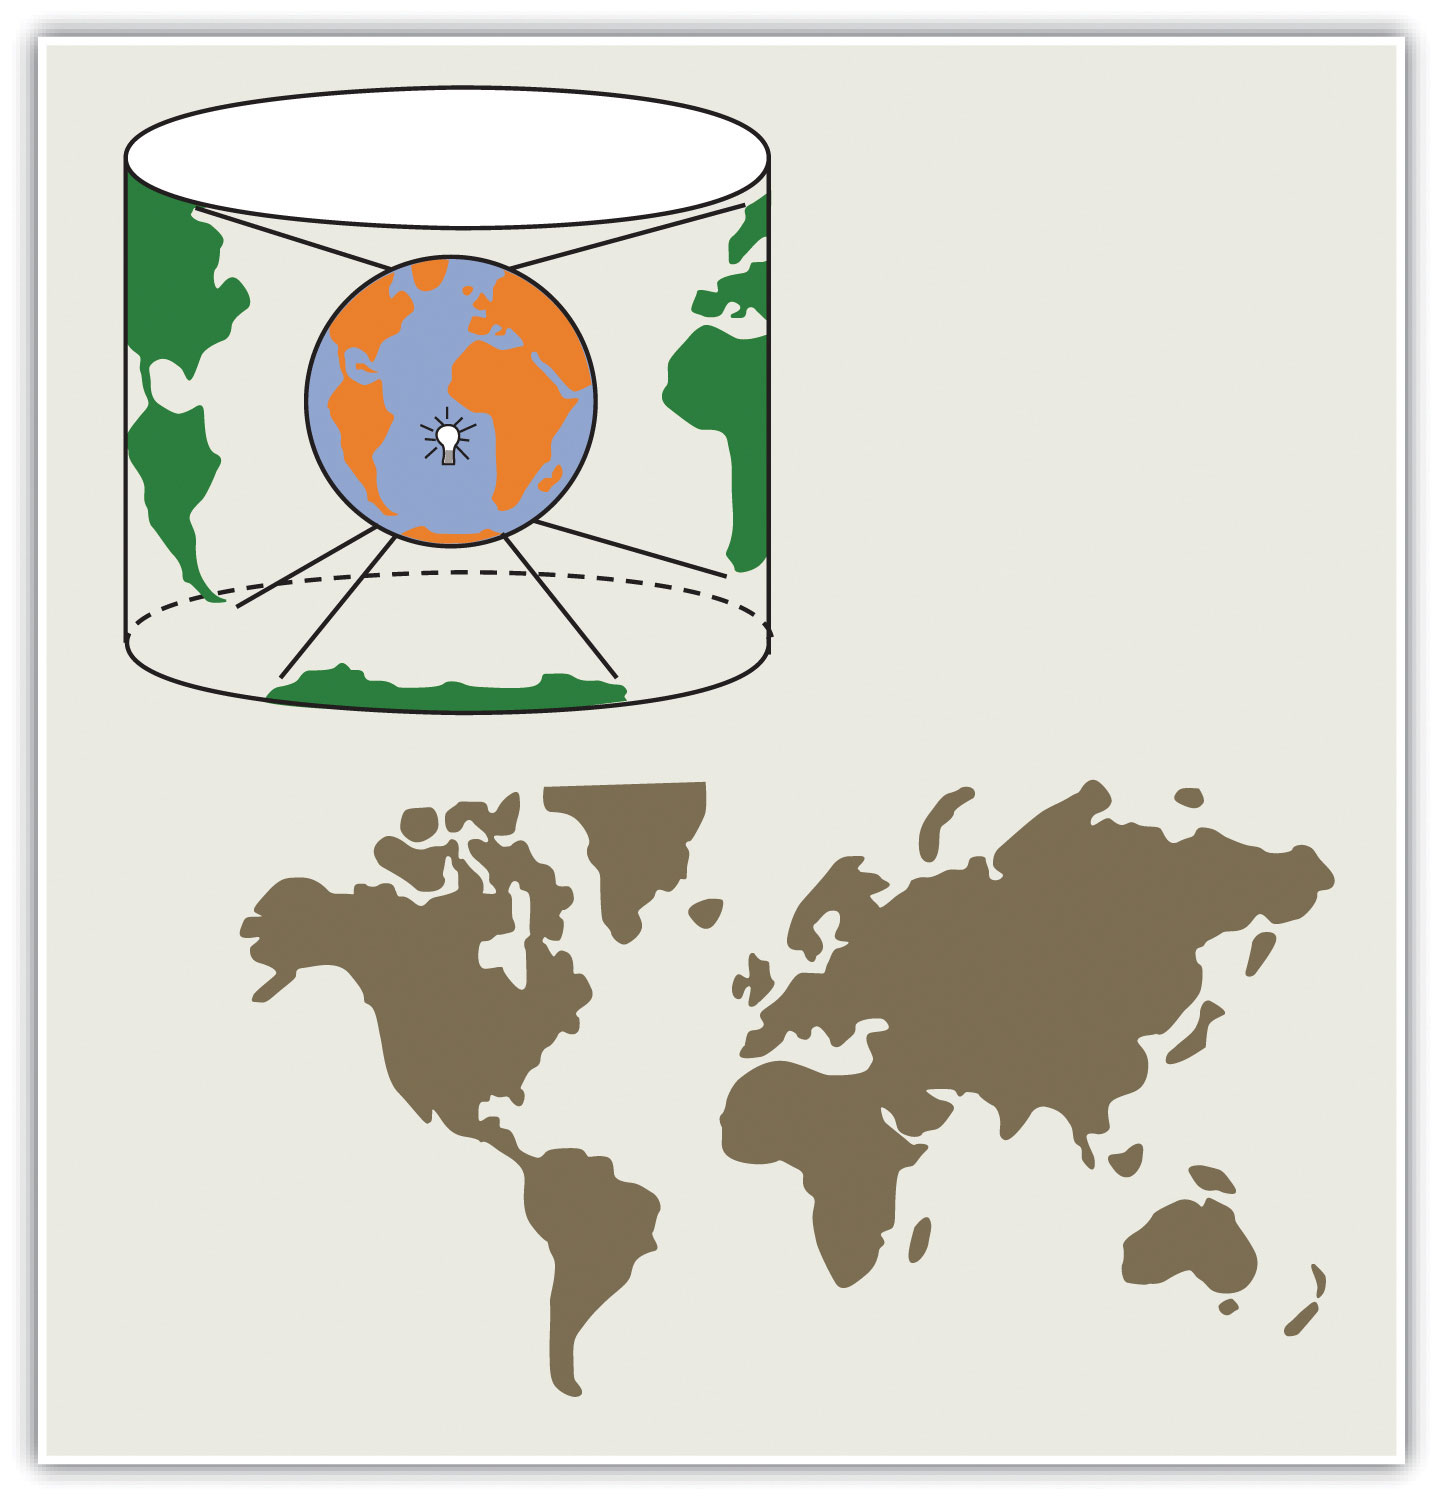
Figure 9.8. Map Projection Conceptualization.
Credit: The Concept of Map “Projection”, Essentials of Geographic Information Systems, Campbell and Shin, CC BY-NC-SA 3.0
Developable Surfaces: A developable surface is a geometric surface on which the curved surface of the Earth is projected; the end result being what we know as a map. Geometric forms that are commonly used as developable surfaces are planes, cylinders, and cones (Figure 9.9) [4]. Naming conventions for many map projections include the developable surface as well as its orientation. For example, as the name suggests, “planar” projections use the plane, “cylindrical” projections use cylinders, and “conic” projections use the cone [1].
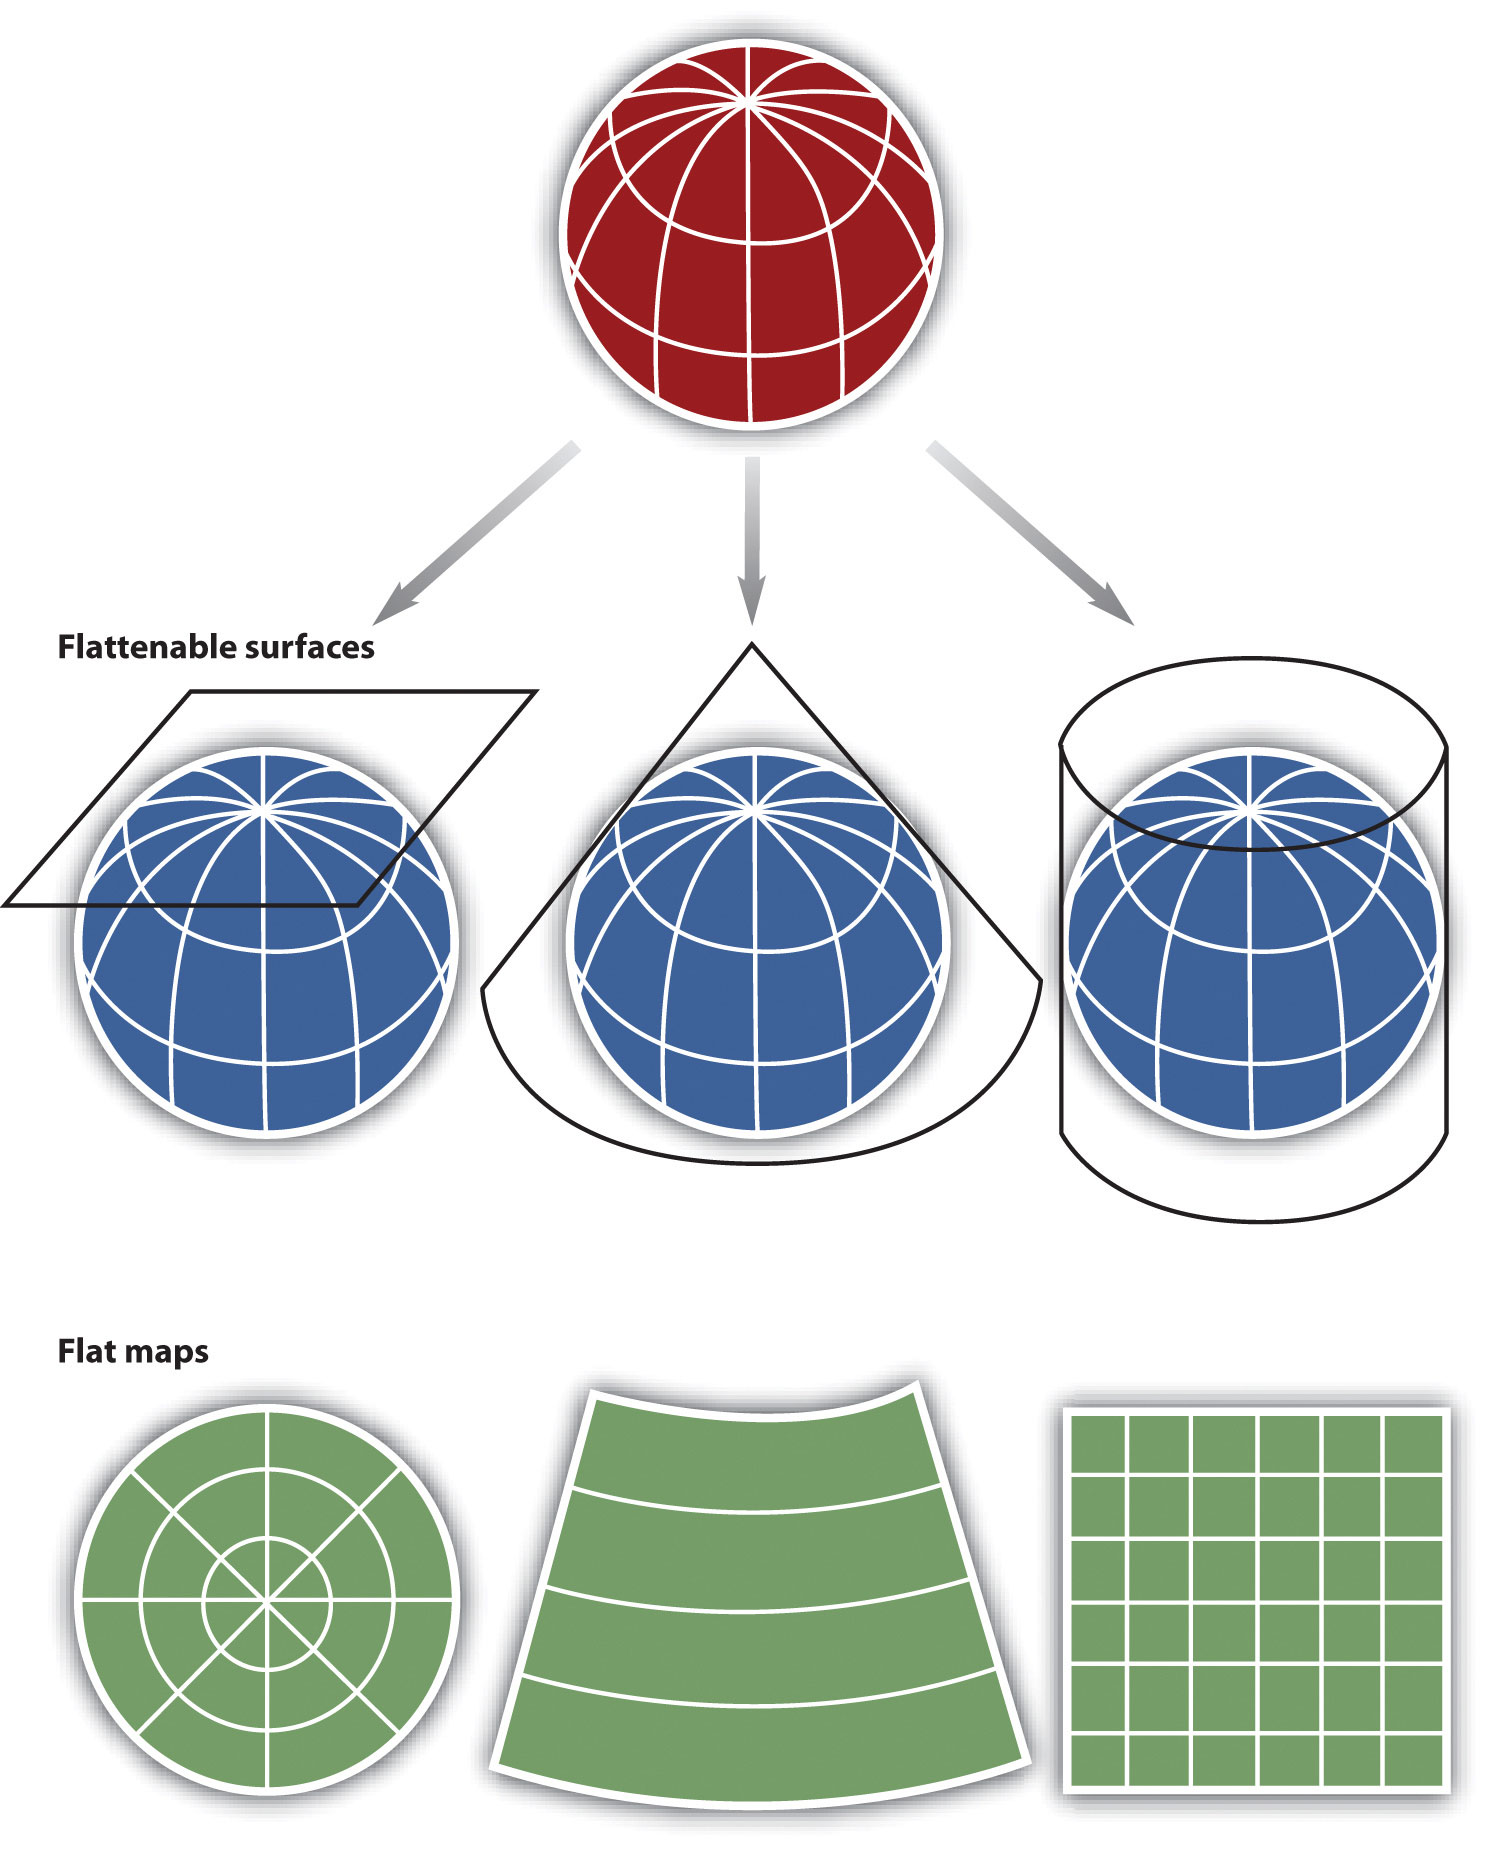
Figure 9.9. Map Projection Surfaces
Credit: Map Projection Surfaces, Essentials of Geographic Information Systems, Campbell and Shin, CC BY-NC-SA 3.0
For cylindrical projections, the “normal” or “standard” aspect refers to when the cylinder is tangential to the equator (i.e., the axis of the cylinder is oriented north–south). When the axis of the cylinder is perfectly oriented east–west, the aspect is called “transverse,” and all other orientations are referred to as “oblique.” Regardless of the orientation or the surface on which a projection is based, a number of distortions will be introduced that will influence the choice of map projection [1].
Tangency: The developable surfaces will interact in a few different ways with the ellipsoid. Generally, the developable surfaces will touch the ellipsoid in either two places which creates two secant lines or at a single location which creates a single tangent line or point [4]. In Figure 9.10 the tangent line of this conic projection is touching one of the mid-latitudes while the secant case is touching two lines of latitude. Figure 9.11 illustrates the tangency and secant case of a cylindrical projection, while Figure 9.12 shows the typical point of tangency for a planar projection. Understanding where the line(s) or point of tangency is important as this is the location on the map with the least amount of distortion. As you move away from the point or line(s) of tangency, distortion increases.
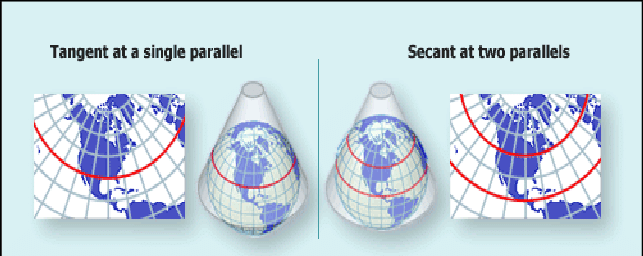
Figure 9.10. Tangent case (left) and secant case (right) of tangency for a conic projection.
Credit: Images by USGS National Atlas, public domain
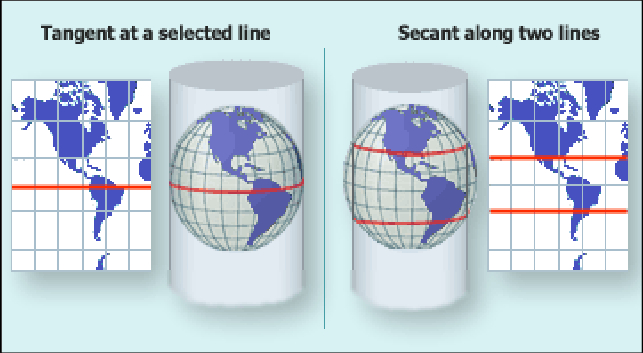
Figure 9.11. Tangent case (left) and secant case (right) of tangency for a cylindrical projection.
Credit: Images by USGS National Atlas, public domain
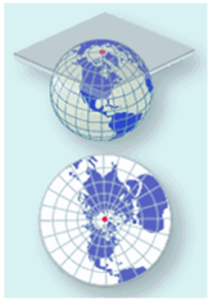
Figure 9.12. Point or line of tangency for a planar projection.
Credit: Image by USGS National Atlas, public domain
Map Projection Parameters: There are five map projection parameters, standard points and lines, projection aspect, central Meridian, latitude of origin, and light source location. Together these five map projection parameters allow an individual to selectively display and distort the Earth to create a map that is suitable to the map purpose [4].
Standard Points and Lines: Defined, a standard point or line is a point or line of intersection between the developable surface and the spheroid or ellipsoid. In the case of a secant intersection, there will be two standard lines that would define where the developable surface intersects with the spheroid. If the developable surface intersects the spheroid along a line of latitude it is known as a standard parallel. Additionally, if a standard line falls on a line of longitude it is known as a standard Meridian. When defining a map projection you must define the standard points and lines. It is not uncommon to have a map projection follow a standard parallel or standard Meridian [4].
Secant intersection between the developable surface and the spheroid can help minimize distortion over a large area by providing more control than a tangent intersection at a single point or line. Therefore placement of standard points and lines (tangency) is one of the most important parameters to consider when defining a map projection [4].
Projection Aspect: Aspect refers to where the developable surface is placed relative to the globe. Each developable surface has what is considered a normal, transverse, and oblique aspect (see projection aspects by developable surface [opens in new tab]).
Light Source Location: There are three hypothetical light source locations for planar projections in reference to the globe – gnomonic, stereographic, and orthographic (Figure 9.13). In the gnomonic light source position, the light source is placed at the center, or core, of the Earth. The light is then projected through the Earth’s surface and projects the landmasses onto the developable surface [4].
In the stereographic projection, the light sources are placed at the opposite side of the Earth from where the developable surface has its secant or tangent intersection. In this case, we see a less severe differential between where the Earth is compressed and elongated, but no location is free from distortion [4].
In the orthographic position, the light is placed at a theoretically infinite distance from Earth opposite from the point of intersection or tangency. This allows formidable distortion in the center of the projection; however, there is significant compression at the extremities of the map [4]. Orthographic is how the Earth is seen from space so is often used to portray the globe as such.

Figure 9.13. The different light sources for planar projections, gnomonic (left), stereographic (middle), orthographic (right).
Credit: Image by Land Survey, Ministry of Rural Affairs and Infrastructure, Sweden, public domain
Great Circle: A great circle is a circle that results when a plane intersects the Earth going through the center effectively dividing the Earth into two equal parts. Based on this definition, all meridians and the equator are considered to be great circles as they all divide the Earth into two equal halves. An arc segment of a great circle is the shortest path between two points on a spherical surface (Figure 9.14). Therefore, to determine the shortest distance between two points on Earth you would first construct a great circle and then calculate the distance along that segment [4].
Rhumb Line: A Rhumb Line is a curve that crosses each Meridian at the same angle (Figure 9.14). This is also known as a loxodrome. Rhumb lines are useful for navigation because they follow a constant bearing or azimuth. While the Rhumb line is useful for navigation, it does require that you follow a longer distance rather than the shortest possible distance, a great circle [4].
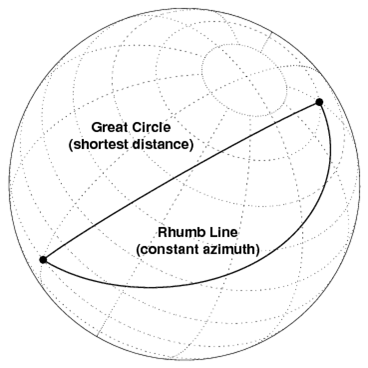
Figure 9.14. Great circle (shorter distance) and rhumb line (constant compass bearing).
Credit: Rhumb line, Introduction to Cartography, Ulrike Ingram, CC BY 4.0
Chapter Review Questions
- If using an Ellipsoid to depict areas of North America, would the same Ellipsoid be able to approximate areas in say Europe? If not explain why.
- The Universal Transverse Mercator (UTM) Coordinate System is split into how many zones?
- While looking at a State Plane Coordinate System, how is error reduced in locating specific areas within a large state such as California or Texas?
- Why is it important to understand the location of the point or line(s) of tangency on a map in terms of distortion?
- What is geodesy?
- How is a datum related to a coordinate system?
Questions were authored by students in GEOG 3053 GIS Mapping, Spring 2024 at CU-Boulder: John Davis, Grady Forsyth, Kevin Frame, Beckett Gonzales, Emily Leahy, Kieran Stone, and one anonymous student.
References – materials are adapted from the following sources:
[1] Essentials of Geographic Information Systems by Saylor Academy under a CC BY-NC-SA 3.0 license
[2] GEOG 486 Cartography and Visualization by Cary Anderson, Pennsylvania State University, under a CC BY-NC-SA 4.0 license.
[3] Geographic Information Systems and Cartography by Adam Dastrup under a CC BY-NC-SA 4.0 license
[4] Introduction to Cartography by Ulrike Ingram under a CC BY 4.0 license
[5] Introduction to GIS by Victor Olaya under a CC BY 3.0 license
[6] Mapping, Society, and Technology by Steven M. Manson under a CC BY-NC 4.0 license
Media Attributions
- Picture1
