8 Generalization
This chapter covers generalization, which requires a person to select and simplify the level of detail on their map to optimize how information is presented. Generalization allows map makers to account for a map’s scale while still accurately representing a landscape. The first part of this chapter introduces the main goals of generalization with most of them addressing persevering the main aspect of the original data. The other goals are standards for maps across all topics of map-making. These goals include standards and ideals for the structure, legend, generalization level, selection of objects, accuracy of objects, accuracy, and legibility of map elements.
The chapter then details the different types of generalization. Selection and Omission involve choosing what to include and what not to include on the map. Simplification is determining and retaining the essential characteristics of the data while excluding unnecessary details. Smoothing is adjusting sharp geographic features to obtain a more straightforward image. Grouping / Aggregation is when information is grouped and expressed in summary form. Displacement / Exaggeration is the visual merging when map elements are too close together after scaling. Finally, Classification and Symbolization are used anytime we classify or categorize data or represent features as an abstraction of their original form (e.g., star for a capital city). After this chapter, you should understand the different types of generalization and why it is crucial for producing a legible and practical map.
Introduction was authored by students in GEOG 3053 GIS Mapping, Spring 2024 at CU-Boulder: Adam Gysin, Ellie Keegan, Michael Milano, Everett Miller, Carly Schwab, and Rachel Smero.
8.0 Generalization
Generalization refers to the selection, simplification, and symbolization of detail according to the purpose and scale of the map. Mapmakers should approach the task of generalization with caution, ensuring they fully understand both the purpose of the map and the characteristics of the items to be generalized before proceeding. The overall goal is to preserve the geographic patterns present in the information while still meeting the map goals at the desired scale and improving communication and legibility of the map [2].
8.1 Goals of Generalization
As it is not possible to communicate map information at a 1:1 scale, generalization has many goals, including the following:
Structure:
- The map content is well structured.
- The map content priorities are adapted to the map’s scale and the intended purpose.
- The objects are classified according to clear and reasonable criteria.
- The grouping of objects is logical.
Legend:
- Expressive and associative symbols constitute the base for clear map communication.
- The size and the form of the symbols are adapted to the other symbols and to the reality.
Generalization level:
- The level/amount of generalization varies according to the purpose and the scale.
- The level of generalization is carefully defined.
Selection of objects:
- The object selection complies with the map’s scale and with the intended purpose.
- The objects that are visible in reality (e.g., houses) are indicated with non-visible objects such as borders or labelling.
Accuracy of objects:
- The optimal accuracy of the objects regarding position and form is reached.
- Displacing objects is only needed for increasing the legibility and for differentiating map features.
- The symbols of visible objects (in reality) have a high accuracy.
Reality accuracy:
- While the reality is revised and changed, the map features represent truth.
- All objects present in the map really exist.
- Appropriate legend symbols are assigned to the objects.
- Labeling is correctly written and assigned.
Legibility of the map elements:
- Good legibility is achieved with respect to the graphical minimal dimensions (sizes and distances) of the symbols.
- Graphical readability rules support legibility.
- Legend is credible and exact.
- The quantitative generalization of objects (e.g., houses) respects the density of objects in reality.
- The relations and dependencies of objects in reality (e.g., streets, rivers, contour lines, etc.) are carefully considered.
Credit: Aims of Generalization, GITTA, Stern et al., CC BY-NC-SA 2.5 [1]
8.2 Types of Generalization
Selection and Omission: Selection is performed by the mapmaker to determine what to include and omission is what they determine to exclude from the map. No modification of the data is required during either process. For example, the mapmaker can decide to depict secondary roads or only major highways, to include only cities with a population of 50,000 people or more, or only include perennial streams (selecting perennial streams and omitting intermittent streams).
Simplification: Simplification is the process that determines the important characteristics of the data, the retention of these important characteristics, and the elimination of unwanted details (Figures 8.0 and 8.1). When reducing the scale of a map, each map item will occupy a proportionately larger amount of space. Consequently, simplification must be practiced in order to ensure legibility and truthful portrayal. The elimination of unwanted map element details (points or features) is the most often used form of simplification. Below are two figures showing examples of simplification [1].
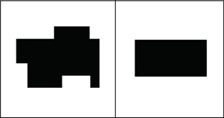
Figure 8.0. Area simplification of a building.
Credit: Shape simplification, GITTA, Stern et al., CC BY-NC-SA 2.5
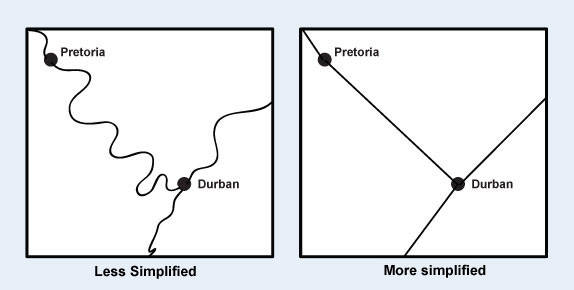
Figure 8.1. Line feature simplification.
Credit: Image from GITTA, Stern et al., CC BY-NC-SA 2.5
Smoothing: Smoothing is the adjustment of the geometry of features on a map in order to maintain a realistic appearance (Figure 8.2). Shorelines, rivers, and borders between countries often have lots of curves and bends. When working at small scales, a mapmaker typically chooses to first simplify and then smooth the shapes of objects and lines [3].

Figure 8.2. Line smoothing.
Credit: Smoothing: reduce sharp angles to smoother curves, Cartography Guide, Axis Maps, CC BY-NC-SA 4.0
Grouping / Aggregation: Aggregation, sometimes called grouping, is the process in which information is gathered and expressed in a summary form (Figure 8.3). As with classification, a common aggregation purpose is to bring relative order and simplicity [1]. For example, a wind farm can be expressed as an area (aggregation) instead of showing individual wind turbines or county data can be aggregated to the state level.

Figure 8.3. Feature aggregation – points to areas.
Credit: Aggregation: group points into an area, Cartography Guide, Axis Maps, CC BY-NC-SA 4.0
Displacement / Exaggeration: When map elements are too close together after scaling, they must be moved in order to avoid their visual merging through displacement or exaggeration (Figures 8.4 and 8.5). This often occurs when features of the same type are in close proximity. Exaggeration specifically aims to make an element seem larger or more important than they are in reality [1]. Both exaggeration and displacement are used to increase the visibility and legibility of the features.

Figure 8.4. Feature displacement.
Credit: Displacement: separate objects (for clarity), Cartography Guide, Axis Maps, CC BY-NC-SA 4.0

Figure 8.5. Feature exaggeration.
Credit: Exaggeration: amplify a part of an object (for clarity), Cartography Guide, Axis Maps, CC BY-NC-SA 4.0
Classification and Symbolization: Anytime we classify or categorize data, generalization is being performed since individual values are lost. Classification is done in order to clarify and emphasize patterns of distribution of a particular phenomenon. See Chapter 11 for more information on data classification. Symbolization is the selection and design of symbols to represent geographic phenomena on a map. Many cartographers feel it should not be included with generalization and for the purposes of this text is discussed in Chapter 5.
Chapter Review Questions
- How does a map’s scale influence the level of generalization?
- How does a map represent the truth despite being generalized?
- How can one achieve good legibility of all map elements?
- What is the purpose of exaggerating features on a map?
- How should a map-maker approach the task of generalization?
Questions were authored by students in GEOG 3053 GIS Mapping, Spring 2024 at CU-Boulder: Adam Gysin, Ellie Keegan, Michael Milano, Everett Miller, Carly Schwab, and Rachel Smero.
Additional Resources
Scale and Generalization: https://gistbok.ucgis.org/bok-topics/scale-and-generalization-1 [open in new tab]
Feature Generalization: https://gistbok.ucgis.org/bok-topics/point-line-and-area-generalization [opens in new tab]
References – materials are adapted from the following sources:
[1] Generalisation of Map Data by Boris Stern, Marion Werner, Lorenz Hurni, and Samuel Wiesmann at the Geographic Information Technology Training Alliance under a CC BY-NC-SA 2.5 license
[2] GEOG 3053 Cartographic Visualization by Barbara Buttenfield, University of Colorado Boulder, used with permission.
[3] Mapping, Society, and Technology by Steven M. Manson under a CC BY-NC 4.0 license
