7 Scale and Resolution
A map, as we have come to understand, is the culmination of conscious decisions made by a cartographer. A cartographer’s mission is to represent some complex phenomena in a comprehensible and visually appealing manner. Among the myriad of decisions to be made, one crucial aspect of map-making is effectively scaling of features and elements to a practical size without sacrificing clarity. Scale and resolution, like other map elements, will inherently impact a viewer’s interpretation of any mapped phenomena. The legibility, accuracy, and usability of any map hinges on the cartographer’s ability to choose the appropriate scale and resolution.
This chapter will introduce you to:
- How map scales are represented – cartographers communicate a map’s scale in 3 different ways and often combine the different formats.
- The differences between large and small-scale maps – choosing the appropriate scale is contingent upon the map’s purpose, format, and audience.
- How to choose the appropriate resolution – the map’s resolution will affect how features are represented and the appropriate resolution depends on whether you have a vector or raster dataset.
By the end of this chapter, you will understand why scale and resolution are important, the different scales, and how to choose the appropriate scale and resolution based on the map’s purpose.
Introduction was authored by students in GEOG 3053 GIS Mapping, Spring 2024 at CU-Boulder: Shelby Holscher, Ayden Johnson, Alexandria Malleris, Alex Tingiri, Kyla Wrenn, and two anonymous students.
7.0 Representations of Map Scale
One of the most significant challenges behind mapping the world and its resident features, patterns, and processes is reducing it to a manageable size. What exactly is meant by “manageable” is open to discussion and largely depends on the purpose and needs of the map at hand. Nonetheless, all maps reduce or shrink the world and its geographic features of interest by some factor. Map scale refers to the factor of reduction of the earth’s features so they fit on a map [3]. A map’s scale can be represented in three ways – a verbal scale, a graphic scale or scale bar, or a representative fraction (Figure 7.0). In all scale representations, the purpose is to demonstrate the relationship between the size/distance represented by the map features versus their size/distance on the earth’s surface, in other words, the map distance relative to the ground distance. Scale can also be defined as the amount of size reduction of the map features.
Graphic Scale / Scale Bar: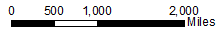
Verbal Scale: One inch on the map equals twenty feet on the ground
Representative Fraction: 1:24,000
Figure 7.0. The three types of scale used on maps.
Credit: Graphic Scale, Introduction to Cartography, Ulrike Ingram, CC BY 4.0 (graphic scale only)
Verbal scale: A verbal scale uses words to describe the relationship between the map distance and ground distance. For example, “one inch equals one mile” gives the map reader a useful explanation of the map scale.
Graphic Scale / Scale Bar: A graphic scale or scale bar is a graphical representation of distance on a map. Scale bars are often more useful than the other representations of scale when the map reader needs to measure to estimate distances on a map. One important advantage of scale bars is that they remain true when maps are shrunk or magnified, unlike the other two types of map scale [4]. Scale bars should be easy to read, not overly large or small relative to the map feature, not be overly complicated or ornate, and use round numbers (100 vs. 105.5). An important concept to keep in mind is that the scale bar is the only scale format that enlarges and reduces relative to the map itself, therefore should be used in situations where scale needs to be represented, but the original map size may be modified.
Representative Fraction: The representative fraction (RF) describes scale as a simple ratio, also called a ratio scale. The numerator, which is always set to one (i.e., 1), denotes map distance and the denominator denotes ground or “real-world” distance. One of the benefits of using a representative fraction to describe scale is that it is unitless. In other words, any unit of measure can be used to interpret the map scale. Consider a map with an RF of 1:10,000. This means that one unit on the map represents 10,000 units on the ground. Such units could be inches, centimeters, or any unit of measurement selected by the map reader [3].
7.1 Large Scale and Small Scale Maps
Map scales can also be described as either “small” or “large.” Such descriptions are usually made based on the representative fractions and the amount of detail represented on a map. For instance, a map with an RF of 1:1,000 is considered a large-scale map when compared to a map with an RF of 1:1,000,000 (i.e., 1:1,000 > 1:1,000,000). In other words, the smaller the denominator the larger the scale (Figure 7.1). Furthermore, while the large-scale maps show more detail and less area, the small-scale maps show more area but less detail [3] (Figure 7.2).
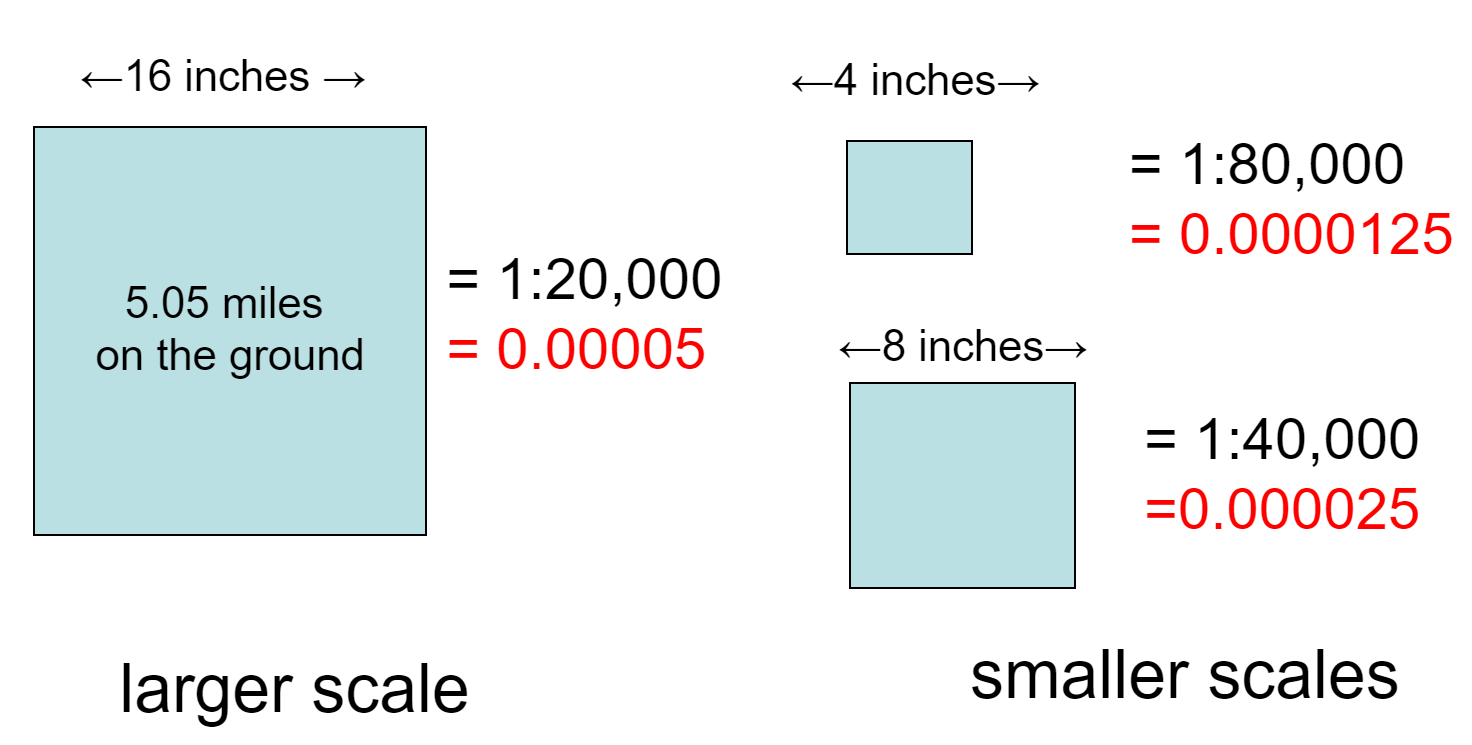
Figure 7.1. Large vs. small scale based on the representative fraction
Credit: graphic by Barbara Buttenfield, University of Colorado Boulder, used with permission
Generally, maps with an RF larger than 1:50,000 (e.g., 1:15,000) are considered large-scale maps, maps with an RF of 1:50,000 – 1:250,000 are of intermediate scale, while maps with an RF smaller than 1:250,000 (e.g., 1:1,000,000) are considered small scale [1].
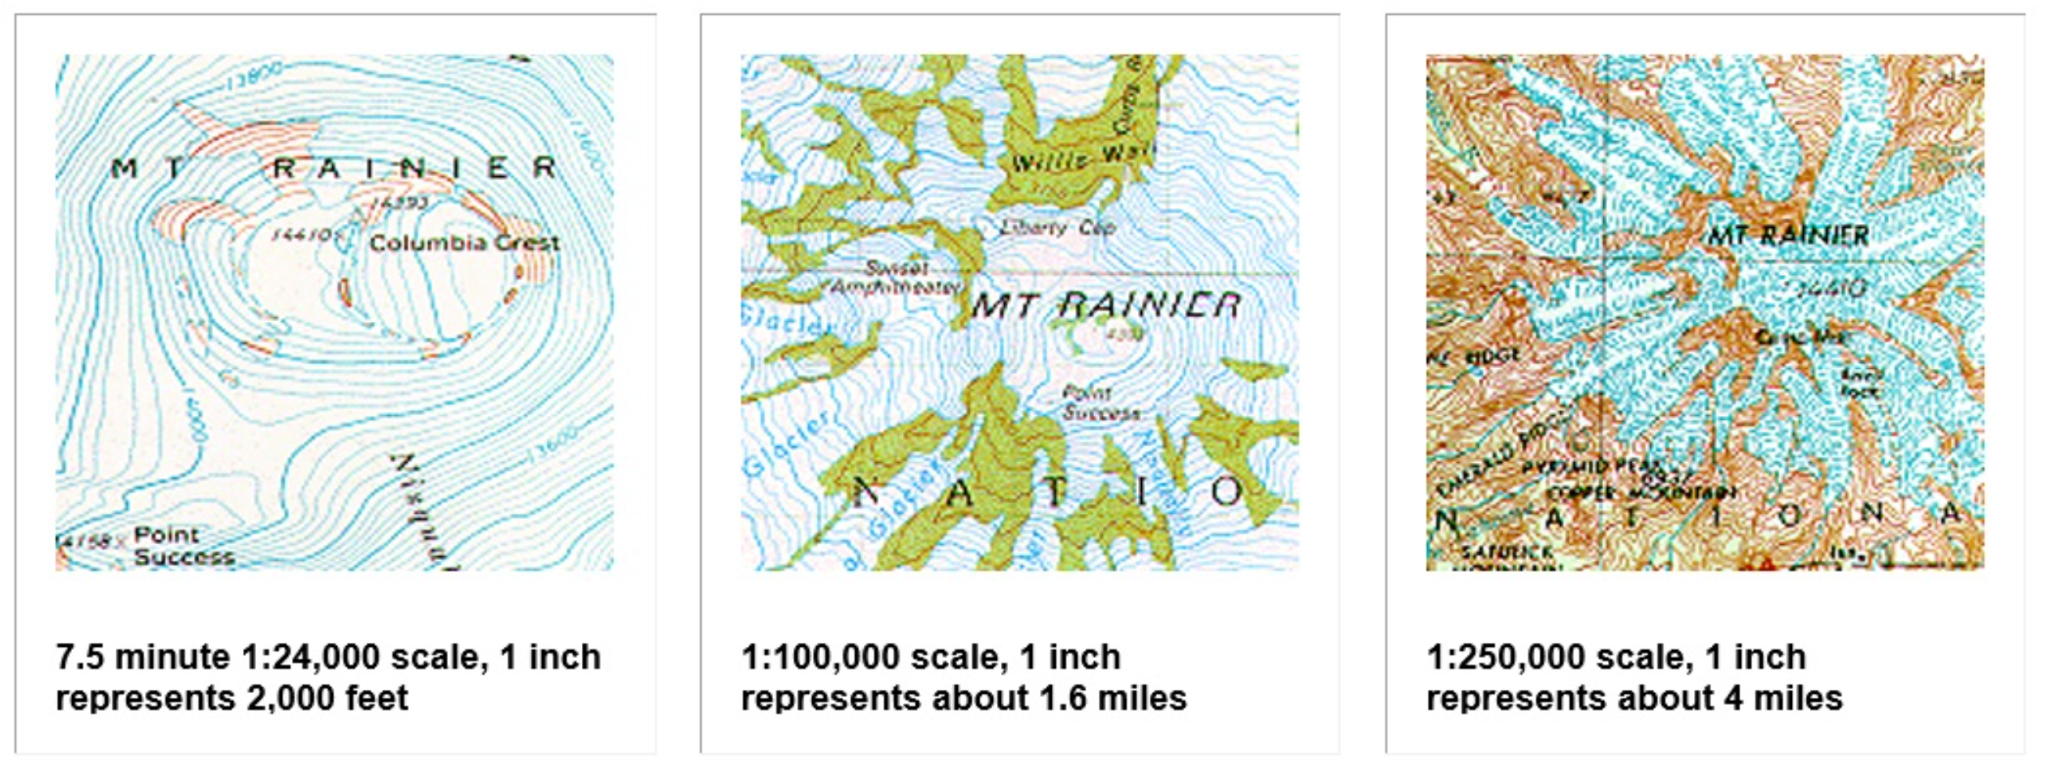
Figure 7.2. Large, intermediate, and small-scale maps of Mt. Rainier in Washington, USA.
Credit: Common Mapping Scales, USGS, public domain
Choosing an Appropriate Scale: Scale choices, first and foremost, should be based on map purpose and expected audience. It will also vary based on the format in which the map will be accessed (e.g., paper map, trailhead sign, or online) and whether or not it is an interactive, web-based map or a static map. The resolution of the data being used will also guide the cartographer towards an appropriate scale. Experienced map makers will ask the following questions before deciding on a map scale – a) what area (geographic footprint) can be shown?; and b) what level of detail can be shown within that footprint? There will always be a tradeoff between the necessary details and the available space in which to fit those map details so it is up to the map designer to make an informed decision based on the factors indicated above [1].
All maps possess a scale, whether it is formally expressed or not. Though some say that online maps and GIS are “scaleless” because we can zoom in and out at will, it is probably more accurate to say that GIS and related mapping technology are multiscalar. Understanding map scale and its overall impact on how the earth and its features are represented is a critical part of both map making and GIS [3].
Representing Scale on Maps: Scale does not always need to be represented on a map, nor in all three formats. Many thematic maps will not require a scale at all, such as that of an election map of the United States, since for such maps, the map reader does not need to measure distance explicitly. One expectation would be that if the map is prepared for users not familiar with the United States; here it is only applied to give the map reader an understanding of the overall scale and the size difference between states. All reference maps should have at least one scale representation, typically a scale bar, especially if the map will be used for navigation or distances need to be measured. World maps almost always include the representative fraction. Topographic maps produced by the USGS always have all three scale formats present.
7.2 Resolution
This section focuses on spatial resolution and how to choose an appropriate resolution based on the map scale. Spatial resolution describes the smallest unit that is mapped [3] or the size of the pixel when referring to raster data. It can also refer to the smallest detectible object on a map or image or the level of detail that can be seen.
When discussing rasters it is best to refer to it as either coarse or fine resolution, rather than low or high, though both are used in the GIS community. In Figure 7.3, the image shows a vector feature in the first column, then the same feature represented as a 30-meter resolution raster. Note how the representation of the feature changes; the area represented by each feature changes as well.
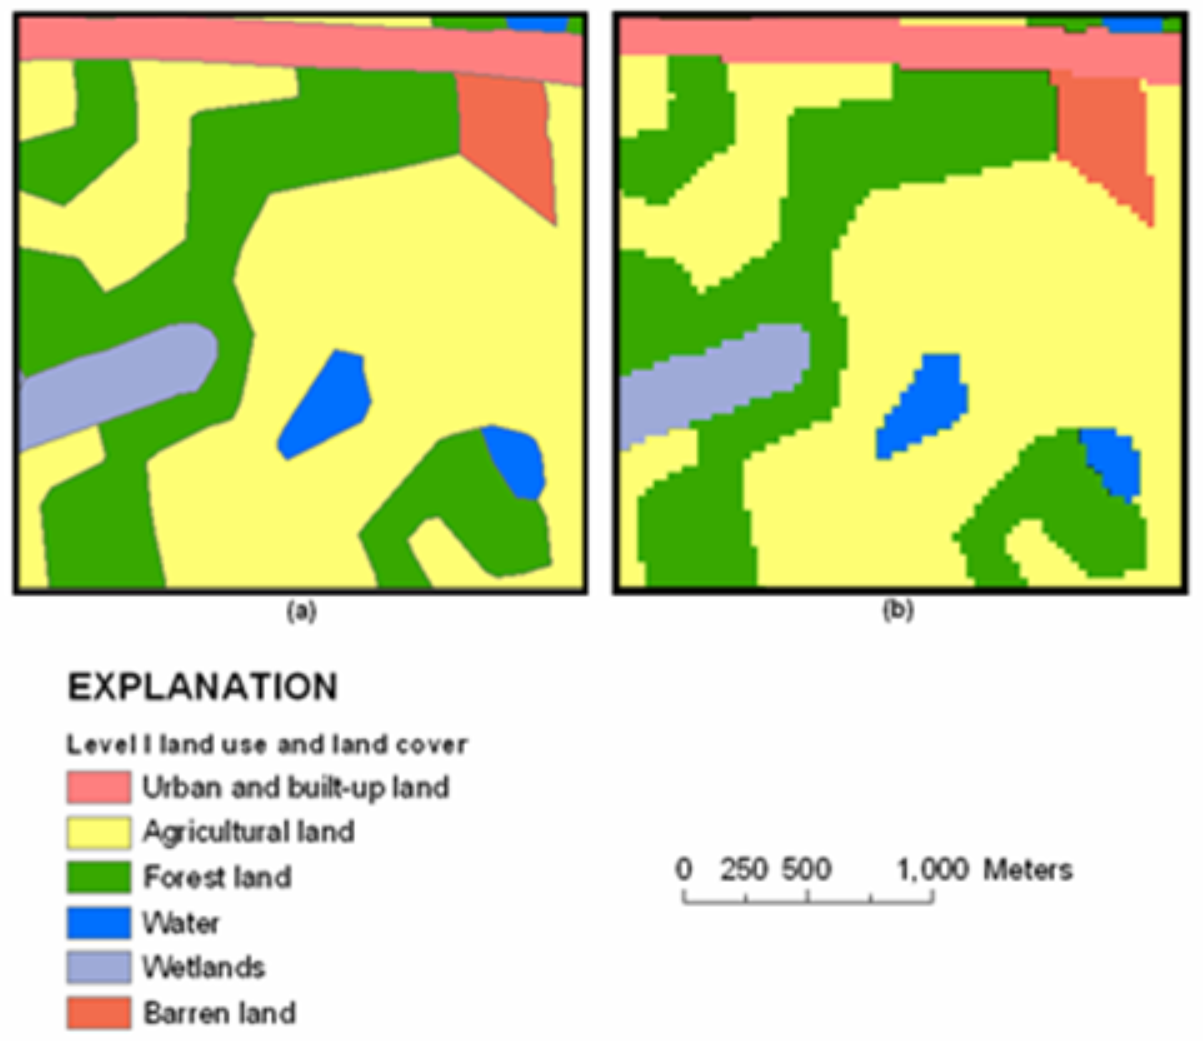
Figure 7.3. Comparing a vector feature (a) and its representation in raster format (b) with 30m resolution.
Credit: Comparison of land-use and land-cover data, adapted from USGS, public domain
Determining Appropriate Spatial Resolution: The spatial resolution refers to the dimensions representing the area of the ground covered by each cell. The finer the resolution, the smaller the cell size, and therefore the more detail the raster will have. As shown in Figure 7.4, the detectable size of a feature is twice that of the raster resolution. For example, if a feature is 10 meters in size, the raster resolution (cell size) needs to be 5 meters (5×5 meter cell) in order to detect the feature in the raster image. Figure 7.4 also indicates the largest scale at which a particular raster resolution should be used. The spatial resolution of a raster needed will also vary based on the particular project, including data availability, what type of map is being created, what type of analysis is being performed, and the storage space available for such data [5].
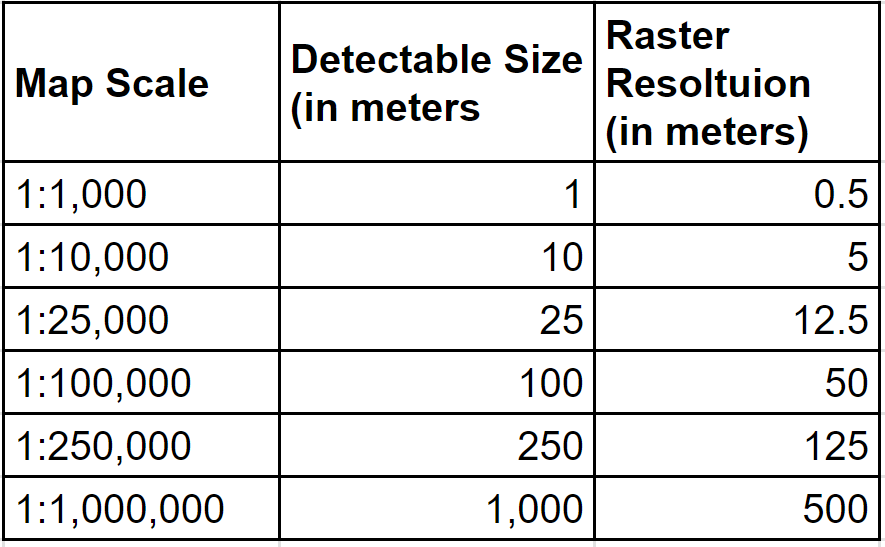
Figure 7.4. Relationship between map scale, feature detection, and raster resolution.
Examine the visual difference between the two images below (Figure 7.5). Note that the resolution is the same, but the scales are different thereby changing what can be detected in the images.
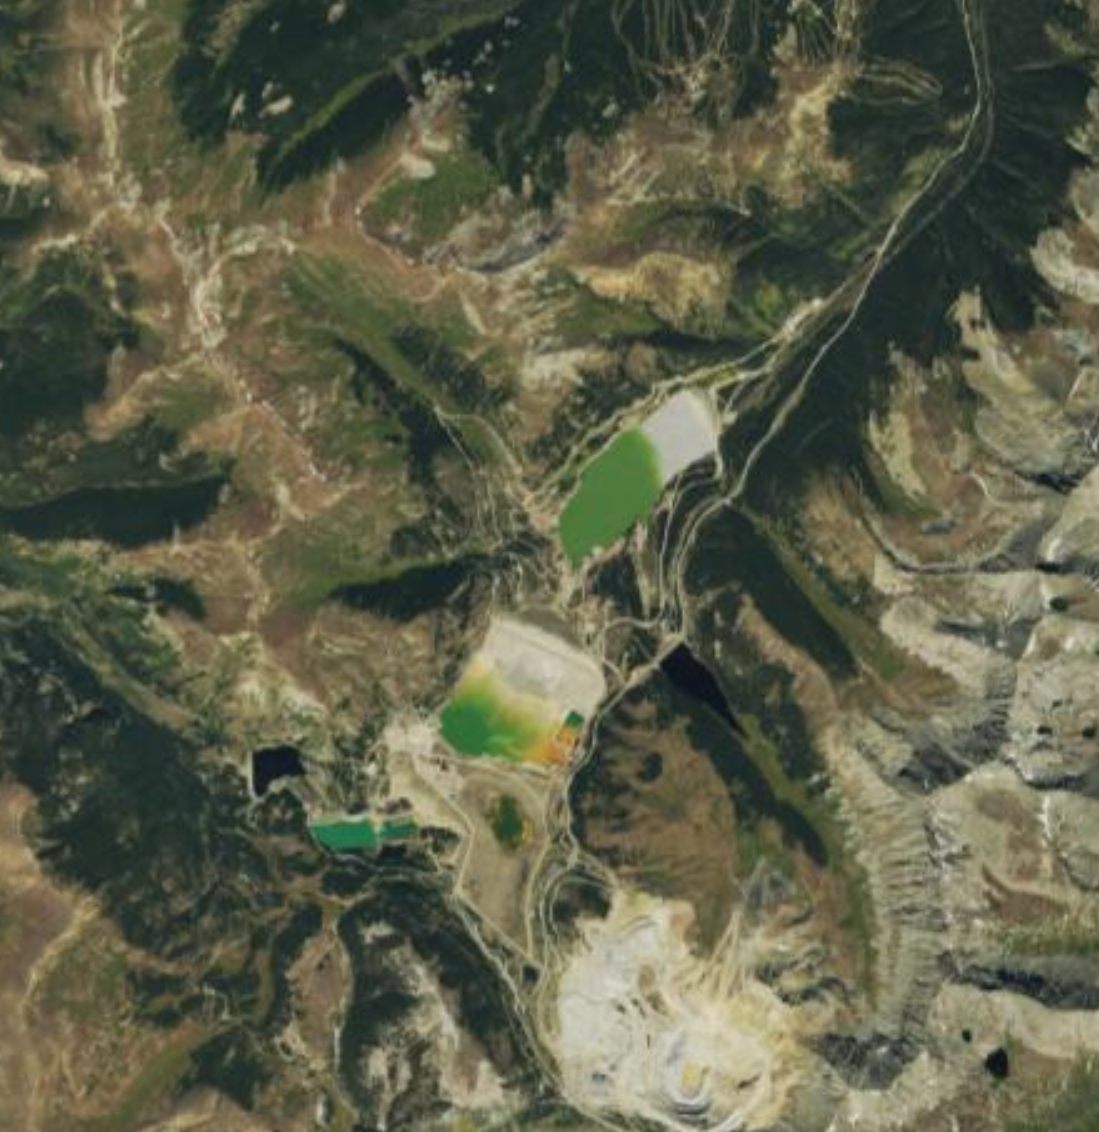
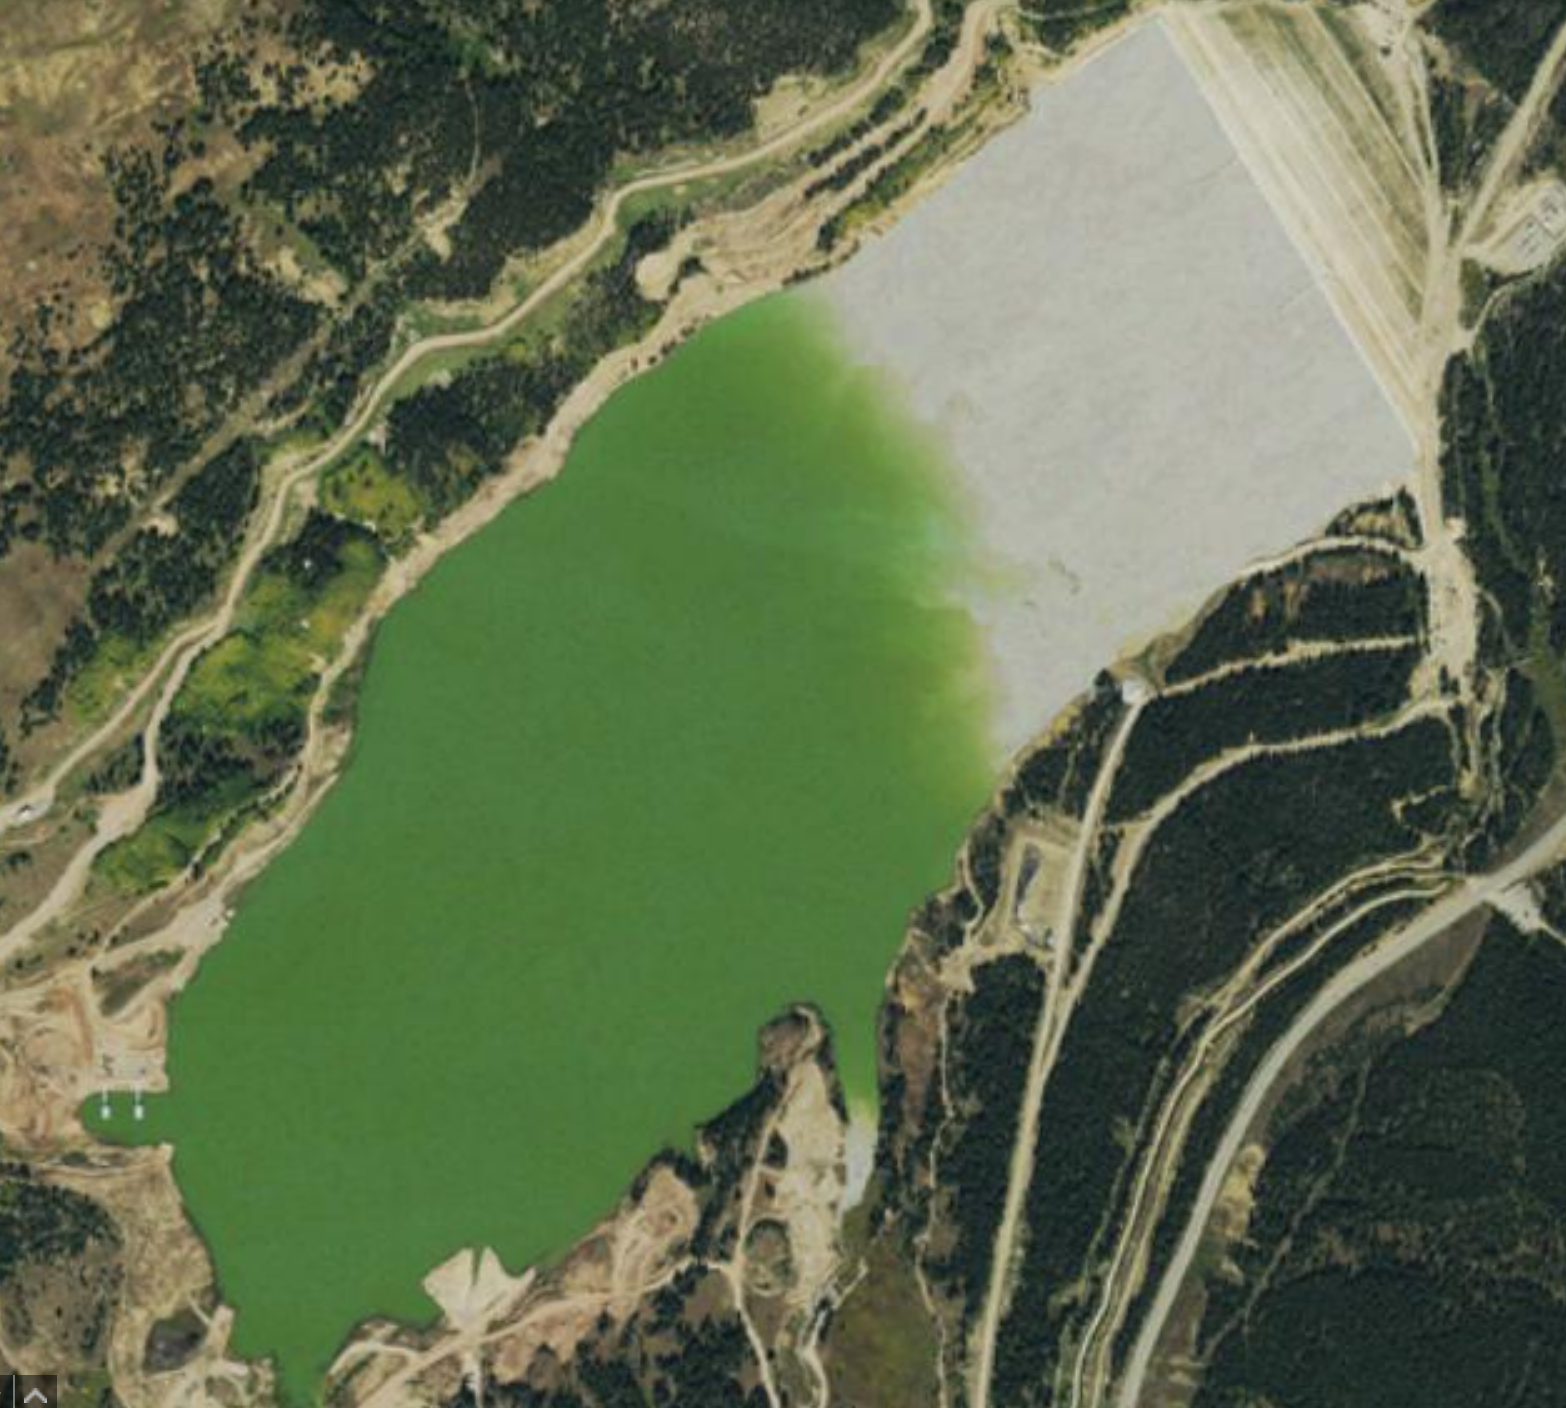
Figure 7.5. Effect of scale changes with constant resolution. Left 1:145,000, right 1:18,000 both using NAIP Plus 1-meter resolution data.
Data Source: USGS, The National Map
Now examine the differences between raster resolutions with a constant scale (Figure 7.6). Note what can be detected and differentiated in the image decreases with increasingly coarser resolution data.
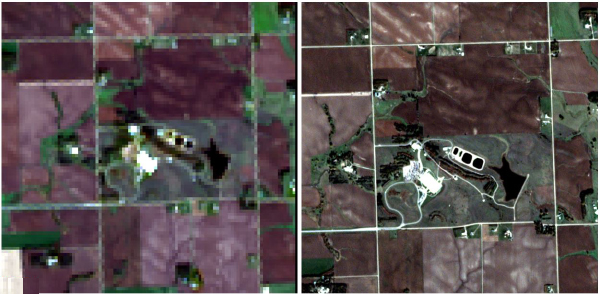
Figure 7.6. Images at the same scale with different raster resolutions, coarse (left) and fine (right).
Credit: Medium Resolution Compared to High-Resolution Image of USGS EROS, USGS, public domain
Converting Between Data Resolution and Scale: Dr. Waldo Tobler, a renowned cartographer, stated that, “the rule is: divide the denominator of the map scale by 1,000 to get the detectable size in meters. The resolution is one-half of this amount” [5].
For example, if you wanted to determine what resolution imagery is needed to detect features at a map scale of 1:10,000, using Tobler’s rule, imagery of approximately 5-meter resolution would be effective [10000/ (1000*2)] [5].
To determine the appropriate scale for a particular raster dataset, the following formula can be applied:
Pixel Size * 1000 ~ RF denominator
For example, if you have a raster dataset with a resolution (pixel size) of 30m, the appropriate scale for use is approximately 1:30,000. The raster resolution needs to be expressed in meters when using this formula. This formula provides an estimate and generally, data can be used in map scales up to 20% larger than yielded by the formula. For our example map scale of 1:30,000, the cartographer could use the 30m data in a map with a scale as large as 1:24,000 without significant consequence. In going from a larger to a smaller scale, you can generalize (modify details) the raster to decrease the resolution. However, when going from smaller to larger scales it is rare to jump to a larger scale, beyond a 20% increase. In that situation, finer resolution data would need to be used [1].
Chapter Review Questions
- How do you determine the appropriate scale for a particular raster dataset?
- Using Tobler’s Rule, what resolution is needed to detect features on a map with a 1:250,000 scale?
- How is resolution different from scale?
- What types of maps do not require scale to be indicated?
- What is a representative fraction and why is it said to be “dimensionless”?
Questions were authored by students in GEOG 3053 GIS Mapping, Spring 2024 at CU-Boulder: Shelby Holscher, Ayden Johnson, Alexandria Malleris, Alex Tingiri, Kyla Wrenn, and two anonymous students.
Additional Resources
Resolution: https://gistbok.ucgis.org/bok-topics/resolution [opens in new tab]
Scale: https://gistbok.ucgis.org/bok-topics/scale-and-generalization-1 [opens in new tab]
References – materials are adapted from the following sources:
[1] GEOG 3053 Cartographic Visualization by Barbara Buttenfield, University of Colorado Boulder, used with permission.
[2] Introduction to Cartography by Ulrike Ingram under a CC BY 4.0 license
[3] Introduction to Geographic Information Systems by R. Adam Dastrup under a CC BY 4.0 license.
[4] Mapping, Society, and Technology by Steven M. Manson under a CC BY-NC 4.0 license
[5] On map scale and raster resolution by Rajinder Nagi, Esri, 2010. https://www.esri.com/arcgis-blog/products/product/imagery/on-map-scale-and-raster-resolution/
