1 Introduction to Cartography
Maps have been made for thousands of years for a variety of purposes. While only a select group known as cartographers used to make maps, today anyone can create a map using geographic information systems (GIS). People in any field of study or work can create maps for consumers, businesses, government agencies, and research using the power of GIS.
This chapter will teach you about:
● Maps are scaled, selective, symbolized, and abstracted.
● What it means to be a cartographer
● What geographic information systems is and how it is defined
● Types of GIS data features (points, lines, and polygons) and their attributes
● Vector and raster file formats, as well as hybrid file formats
● Geodatabase types used in GIS
After reading this chapter you should be able to understand what a map is, how GIS is used to make a map, and the different types of GIS data that make it all possible.
Introduction authored by students in GEOG 3053 GIS Mapping, Spring 2024 at CU-Boulder: Zade Baldwin, Callum Chisholm, Jacob Fenner, Rian Finley, and two anonymous students.
1.0: Defining a Map
Maps are a graphic representation of the earth, showing the spatial relationship of the earth’s features whether cultural or physical. Central to this representation is reducing the earth’s features of interest to a manageable size (i.e., map scale) and its transformation into a functional two-dimensional form (i.e., map projection). As all maps are visual representations of selected phenomena, a cartographer must consider the key concepts that make a map a map: it is a scaled, selective, symbolized, and abstracted graphical representation of the phenomenon [2] [3].
Scaled: Scaled refers to the fact that almost all maps are more useful when they are reproduced at a smaller scale than the actual phenomenon being mapped. For example, a road map of Idaho that when unfolded is the actual size of Idaho, is not very useful to us, so instead, we reduce the size of the spatial phenomenon being represented onto a more reasonably sized piece of paper [3].
Selective: Selective means that maps should only include items that are directly related to the message of the map. For instance, a map designated to show where all the hospitals are located within a city should not include the location of every manhole cover in the city. The reason being, the location of the manhole covers is irrelevant to the locations of the hospitals, and therefore it would be a meaningless feature on the map and likely detrimental to achieving the map’s purpose [3].
Symbolized: Symbolized, refers to the idea of extracting the item being mapped by using a representative symbol. Examples of representative symbols would be a star with a circle around it that represents a state capital, or a symbol of the front of a bus that represents a bus stop [3].
Abstracted: Decisions about how to classify, simplify, or exaggerate features and how to symbolize objects of interest simultaneously fall under the realms of art and science. Moving from the real world to the world of maps is map abstraction. This process involves making choices about how to represent features. Regarding geographic information systems (GIS), we must be explicit, consistent, and precise in defining and describing geographical features of interest [2].
1.1 Defining Cartography
Cartography is the art and science of making maps along with their study as scientific works of art. It involves the process of producing a map through the philosophical and theoretical basis of map- making. A cartographer is someone who designs and prepares a map for distribution. More specifically, a cartographer is someone who studies the philosophical and theoretical basis of the rules for making maps. Traditionally, only cartographers made maps and these cartographers were considered skilled workers that required many years of apprenticeship and practice. However, in recent history, cartography has been democratized and now many different groups create maps without the use of someone specifically trained in cartography [3].
Cartography is seldom a stand-alone profession and is now seen as a skill set possessed by geographers, geographic information scientists, or anyone else who wishes to create a map. The profession of cartography still does exist and is important to many fields of study including environmental science, business, and epidemiology [3].
1.2 Defining GIS
Geographic information systems (GIS), are computer systems used to store, visualize, analyze, manage, edit, and interpret geographic data. GIS data, often referred to as spatial or geospatial data, includes both attribute and spatial information about a feature. For example, you may have data for Boulder County that indicates both its geospatial location on the earth’s surface and have attributes about the county in tabular format such as the number of residents, percentage of people living in poverty, and median household income. The first GIS was developed in the early 1960s by Roger Tomlinson, referred to as the “father of GIS” [4]. For more information about the history of GIS and spatial analysis see “A Brief History of GIS” [opens in new tab].
What is GIS? Video [opens in new tab]
1.3 Types of GIS Data
Within the realm of maps, cartography, and GIS, the world is made up of various features. Such features include but are not restricted to points of interest, roads, rivers, lakes, soils, oceans, and buildings. Moreover, such features have a form, and more precisely, a geometric form. For instance, cities and power poles are considered point-like features; rivers and streams are linear features; and lakes, countries, and forests are areal (aka polygon) features [1].
Features can also be categorized as either discrete or continuous. Discrete features are well-defined and are easy to locate, measure, and count, and their edges or boundaries are readily defined. Examples of discrete features include buildings, roads, and parks. Continuous features are less well- defined and exist across space. The most commonly cited examples of continuous features are temperature and elevation. Changes in both temperature and elevation tend to be gradual over relatively large areas [1].
Geographical features also have several characteristics, called attributes, associated with the spatial feature. For instance, a forest may be further described by its attributes, for instance, whether it is made up of deciduous, coniferous, or a mix of both types of trees. More general attributes may include measurements such as tree density per acre or average canopy height in meters [1].
GIS data must include the spatial location and extent of the feature(s), which allows us to define its location on the surface of the earth. Such data include but are not limited to the latitude and longitude coordinates of points of interest, street addresses, postal codes, political boundaries, and even the names of places of interest. It is also important to note the difference between spatial data and attribute data, whereas spatial data are concerned with defining the location of an object of interest, attribute data are concerned with its nongeographic traits and characteristics [1].
1.4 GIS Files Formats
Geospatial data are stored in many different file formats. Each geographic information system (GIS) software package and version supports different formats. Although several of the more common file formats are summarized here, many other formats exist for use in various GIS programs [1].
Vector File Formats: The most common vector file format is the shapefile. Shapefiles, developed by ESRI in the early 1990s, are simple, files developed to store the geometric location and attribute information of geographic features. Shapefiles are incapable of storing null values. Field names within the attribute table are limited to ten characters, and each shapefile can represent only one type of geometry, i.e. either point, line, or polygon features. Supported data types are limited to floating point, integer, date, and text. Shapefiles are supported by almost all commercial and open-source GIS software [1].
Despite being called a “shapefile,” this format is actually a compilation of many different files. Figure 1.0 lists and describes the different file formats that can associated with a shapefile. Among those listed, only the SHP, SHX, and DBF file formats are mandatory to create a functioning shapefile [1].
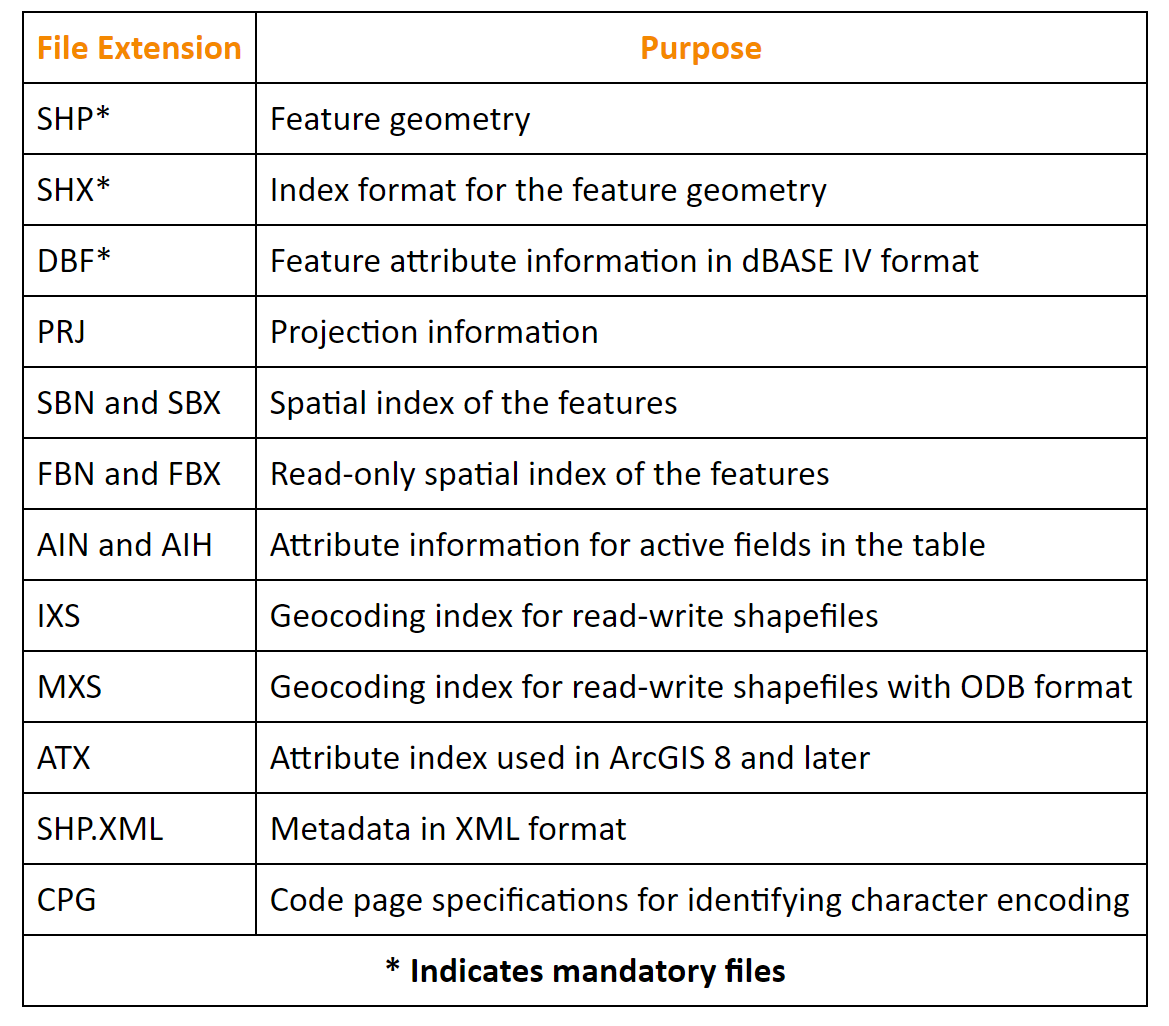
Figure 1.0. Shapefile extensions and purposes.
Credit: Shapefile file types, Essentials of GIS, Campbell and Shin, CC BY-NC-SA 3.0
Raster File Formats: A multitude of raster file format types are available for use in GIS. Due to ongoing technological advancements, raster image file sizes have increased significantly. To deal with this potential constraint, two types of file compression are commonly used: lossless and lossy. Lossless compression reduces file size without decreasing image quality. Lossy compression attempts to exploit the limitations of the human eye by removing information from the image that cannot be sensed. Lossy compression results in smaller file sizes than lossless compression [1].
Among the most common raster files used on the web are the JPEG (Joint Photographic Experts Group), TIFF (Tagged Image File Format), and PNG (Portable Network Graphics) formats, all of which are open source and can be used with most GIS software packages. However, native JPEG, TIFF, and PNG files do not have georeferenced information associated with them and therefore cannot be used in any geospatial mapping efforts without them first being georeferenced [1], meaning that a geographic coordinate system has been assigned to the data. Some raster data is available in GeoTIFF format which has already been georeferenced.
An example of a raster file format with explicit georeferencing information is the proprietary MrSID (Multiresolution Seamless Image Database) format. This lossless compression format was developed for use with large aerial photographs or satellite images [1].
Some raster file formats are developed explicitly for modeling elevation. The USGS DEM (US Geological Survey Digital Elevation Model) is a popular file format due to widespread availability and extensive software support for the format. Each pixel value in these grid-based DEMs denotes spot elevations on the ground, usually in feet or meters. DEMs are referred to as digital terrain models (DTMs) when they represent a bare-earth model and as digital surface models (DSMs) when they include the heights of landscape features such as buildings and trees [1].
Hybrid File Formats: Geodatabases have been developed in a proprietary ESRI file format that supports both vector and raster feature datasets (e.g., points, lines, polygons, annotation, JPEG, TIFF) within a single file, which serves as a container for multiple data layers and information [1]. Geodatabases function as containers for organizing and storing geospatial data, with different types of geodatabases having different functionality and size limits.
There are three different types of geodatabases. The personal geodatabase was developed for single-user editing, whereby two editors cannot work on the same geodatabase at a given time. The personal geodatabase employs the Microsoft Access DBMS file format and maintains a size limit of 2 gigabytes per file. The personal geodatabase is used by ESRI ArcGIS versions 8.x to 10.x; it is not compatible with any versions of ArcGIS Pro [1].
The file geodatabase similarly allows only single-user editing, but this restriction applies only to unique feature datasets within a geodatabase. The file geodatabase incorporates new tools such as domains (rules applied to attributes), subtypes (groups of objects with a feature class or table), and split/merge policies (rules to control and define the output of split and merge operations). This format has a size limit of 1 terabyte. File databases are not tied to any specific relational database management system (e.g., Microsoft Access) and can be employed on both Windows and UNIX platforms [1].
The ArcSDE geodatabase allows multiple editors to simultaneously work on feature datasets within a single geodatabase (a.k.a. versioning). Like the file geodatabase, this format can be employed on both Windows and UNIX platforms. File size is limited to 4 gigabytes and its proprietary nature requires an ArcInfo or ArcEditor license for use. The ArcSDE geodatabase is implemented on the SQL Server Express software package, which is a free DBMS platform developed by Microsoft [1].
Chapter Review Questions –
- Why must maps be made at scale?
- What GIS file format represents points, lines, and polygons as discrete features?
- What are some examples of continuous features? Discrete features?
- How are Lossless and Lossy raster files different?
- Which geodatabase is designed for multi-user editing?
Questions authored by students in GEOG 3053 GIS Mapping, Spring 2024 at CU-Boulder: Zade Baldwin, Callum Chisholm, Jacob Fenner, Rian Finley, and two anonymous students.
References – materials are adapted from the following sources:
[1] Essentials of Geographic Information Systems by Saylor Academy under a CC BY-NC-SA 3.0 license
[2] Geographic Information Systems and Cartography by Adam Dastrup under a CC BY-NC-SA 4.0 license
[3] Introduction to Cartography by Ulrike Ingram under a CC BY 4.0 license
[4] Introduction to GIS by Victor Olaya under a CC BY 3.0 license
