10 Map Projections
10.0 Map Projections
Cartographers have developed hundreds of map projections, which are grouped into three main families based on the type of geometric shape that is used to transform a sphere into a plane. These families are called developable surfaces and consist of cylinders, cones, and planes. A number of other map projections are based on a polyhedron (e.g., Fuller-Dymaxion), though they are not described here.
Planar Family: The planar or azimuthal map projection family is when a spheroid is projected onto a flat plane. Based on this interaction between the spheroid and a developable surface we see distortions increasing in a series of concentric bands from the point of tangency. The planar family of map projections is commonly used to display larger-scale maps and polar regions of the Earth. The planar family’s normal aspect is polar [4].
Cylindrical Family: The cylindrical family projects the spheroid onto a cylinder that when rolled flat is a rectangle. The spheroid is distorted with increasing exaggeration towards the outer edges of the map, typically the north and south poles, as the standard aspect for a cylindrical map is equatorial. The cylindrical map projection family is commonly used to display the entire world, though can beused for maps at any scale. One unique characteristic of the cylindrical family is that all parallels and meridians intersect at 90° angles [4].
Conic Family: The conic family uses a cone onto which the spheroid is projected. Distortion is present in concentric bands moving outward from the line of tangency which the standard is a parallel in the mid-latitudes and the normal aspect is polar. The conic family is commonly used to display areas of Earth having a greater east-west extent [4].
10.1 Map Projection Distortions
All projected maps alter the area, shape, distance, and/or direction of a map or its features. Map projection properties exist because the conversion of a three-dimensional object, such as the Earth, to a two-dimensional representation, such as a flat paper map, requires the distortion of the three-dimensional object. The three-dimensional spherical surface is torn, sheared, or compressed to fit the developable surface. The four map projection properties described can either be held true or distorted [4].
Area and shape are considered major properties and are mutually exclusive. That means, that if area is held to its true form on a map, shape must be distorted, and vice versa. Distance and direction, on the other hand, are minor properties and can coexist with any of the other projection properties. However, distance and direction cannot be true everywhere on a map [4].
Compromise projections do not hold a single map projection property true. Their goal is to simultaneously minimize all map distortion properties, but may not hold any of the four map projection properties as true.
10.2 Projection Examples
The map projections discussed below are done so by the property in which the projection holds true (does not distort).
Equal Area Map Projections: The equal area map projection, also known as the equivalent map projection, preserves the area relationships of all parts of the globe. You can easily identify most equal area map projections by noting that the meridians and parallels are not at right angles to each other. Additionally, distance distortion is often present on equal area map projections, and the shape is often skewed [4].
Equal area maps are useful for quantitative thematic maps when it is desirable to retain area properties, such as for dot density maps. This is especially useful for choropleth maps when the attribute is normalized by area. Holding area true allows comparison of density between different enumeration units such as counties. One example of an equal area projection is the Lambert Cylindrical Equal Area projection (Figure 10.1) [4].
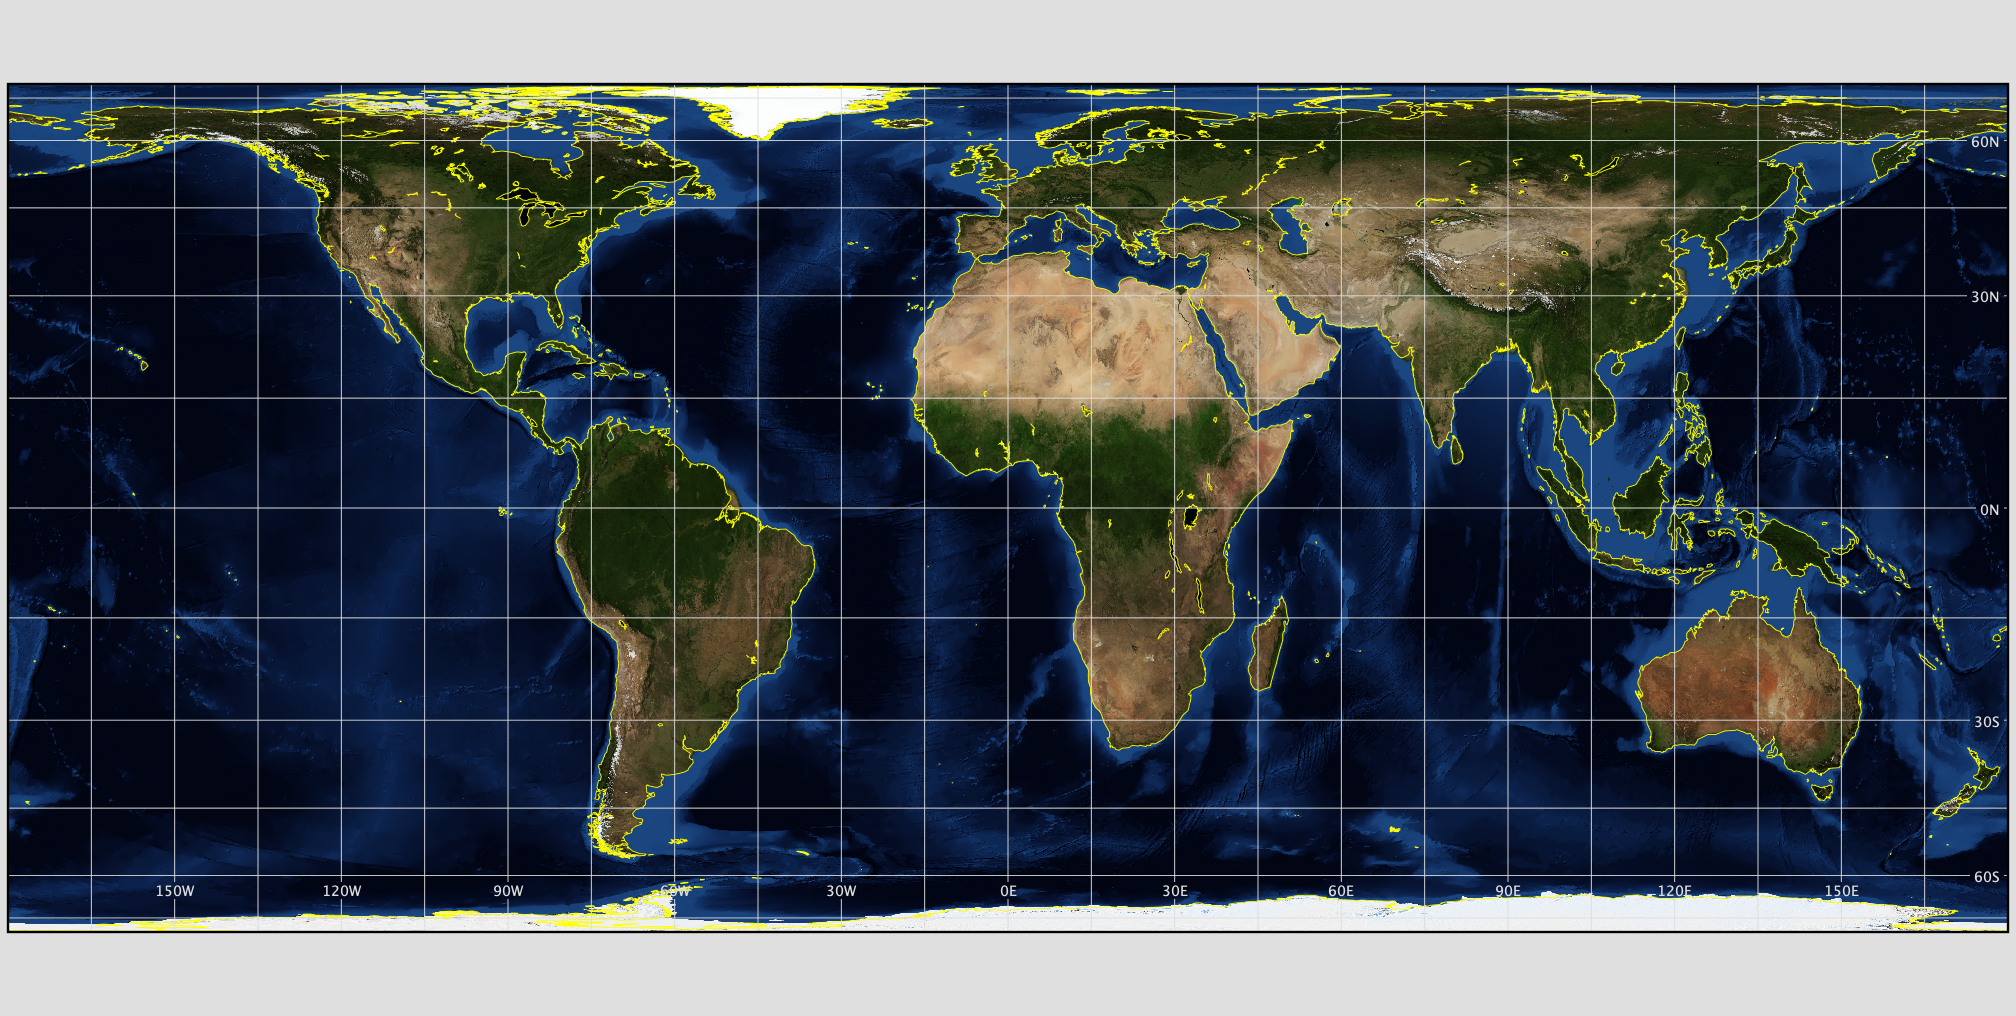
Figure 10.1. Lambert cylindrical equal-area projection
Credit: Image from Map Projection Explorer, NASA, public domain
Conformal Map Projections: Conformal map projections preserve angles and thus the shape of the map features. These projections can usually be identified by the fact that meridians intersect parallels at right angles and areas are distorted significantly [4]. Conformal projections should be used if the main purpose of the map involves measuring angles or representing the shapes of features. They are very useful for navigation, topography (elevation), and weather maps [6].
The Mercator projection (Figure 10.2), perhaps the most famous of all map projections, is a conformal map projection that preserves shape. However, notice the massive amount of distortion in the lower latitudes towards the South Pole and the northern latitudes near the North Pole. Also, note that the parallels and meridians intersect at 90° angles [4].

Figure 10.2. Mercator Map Projection
Credit: Image from Map Projection Explorer, NASA, public domain
Equidistant Map Projections: The equidistant map projection aims to preserve great circle distances which means a distance can be held true from one point to all other points or from a few select points to others but not from all points to all other points. Identifying marks of the equidistant map projection are that they are neither conformal nor equal area, and tend to look less distorted (Figure 10.3). Equidistant map projections are useful for general-purpose maps and Atlas maps [4].
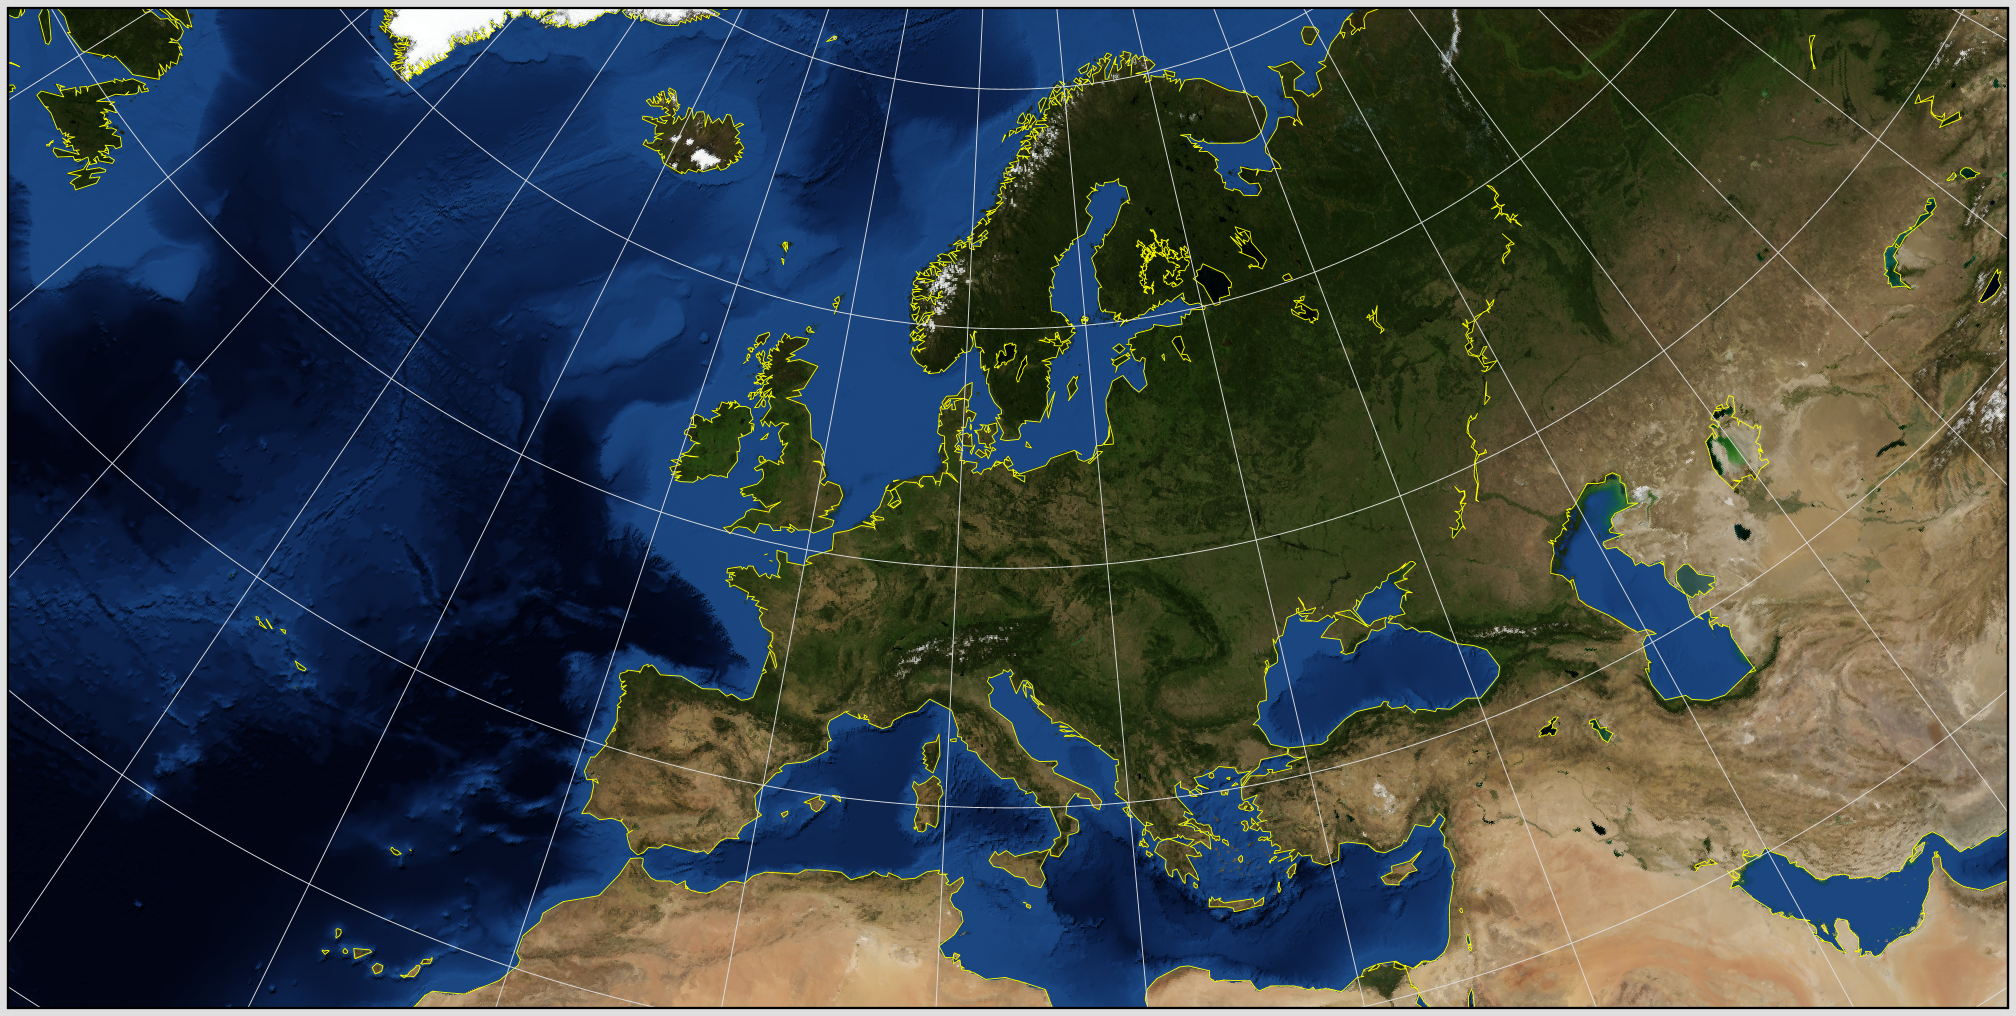
Figure 10.3. Equidistant Conic Projection
Credit: Image from Map Projection Explorer, NASA, public domain
Azimuthal Map Projection (Equidirectional): The azimuthal map projection (Figure 10.4), also known as the true direction map projection, preserves direction from one point to all other points in the map (shape, area, and distance are distorted). It is important to note that direction is not true between non-central points. Direction is only true when measured to or from the specific points chosen to have true direction. Azimuthal map projection is often used for navigation [4].
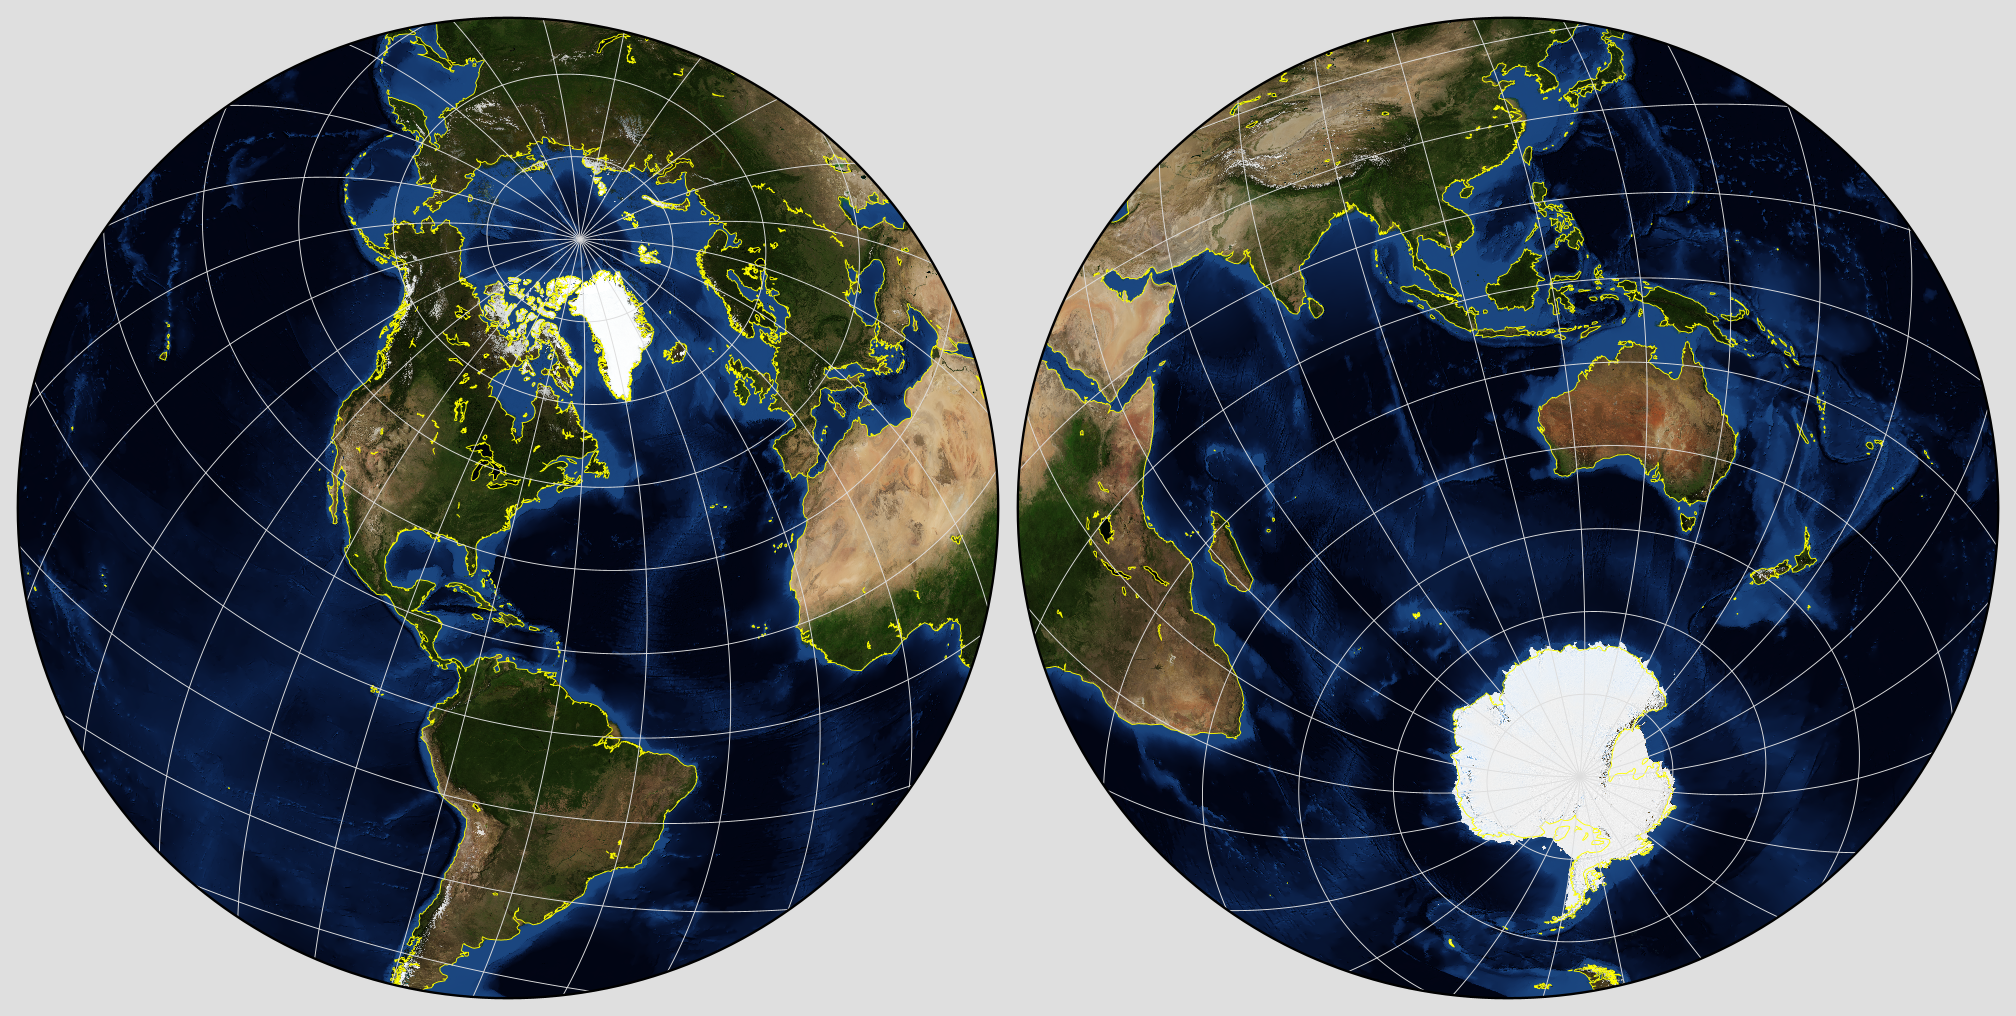
Figure 10.4. Azimuthal Equidistant Map Projection
Credit: Image from Map Projection Explorer, NASA, public domain
Compromise Map Projection: A compromise projection preserves no one property but instead seeks a compromise that minimizes distortion of all kinds, as with the Robinson projection (Figure 10.5), which is often used for small-scale thematic maps of the world [6]. Compromise projections, in general, do a reasonable job of showing the true shape, distance, direction, and area of the features of the Earth.
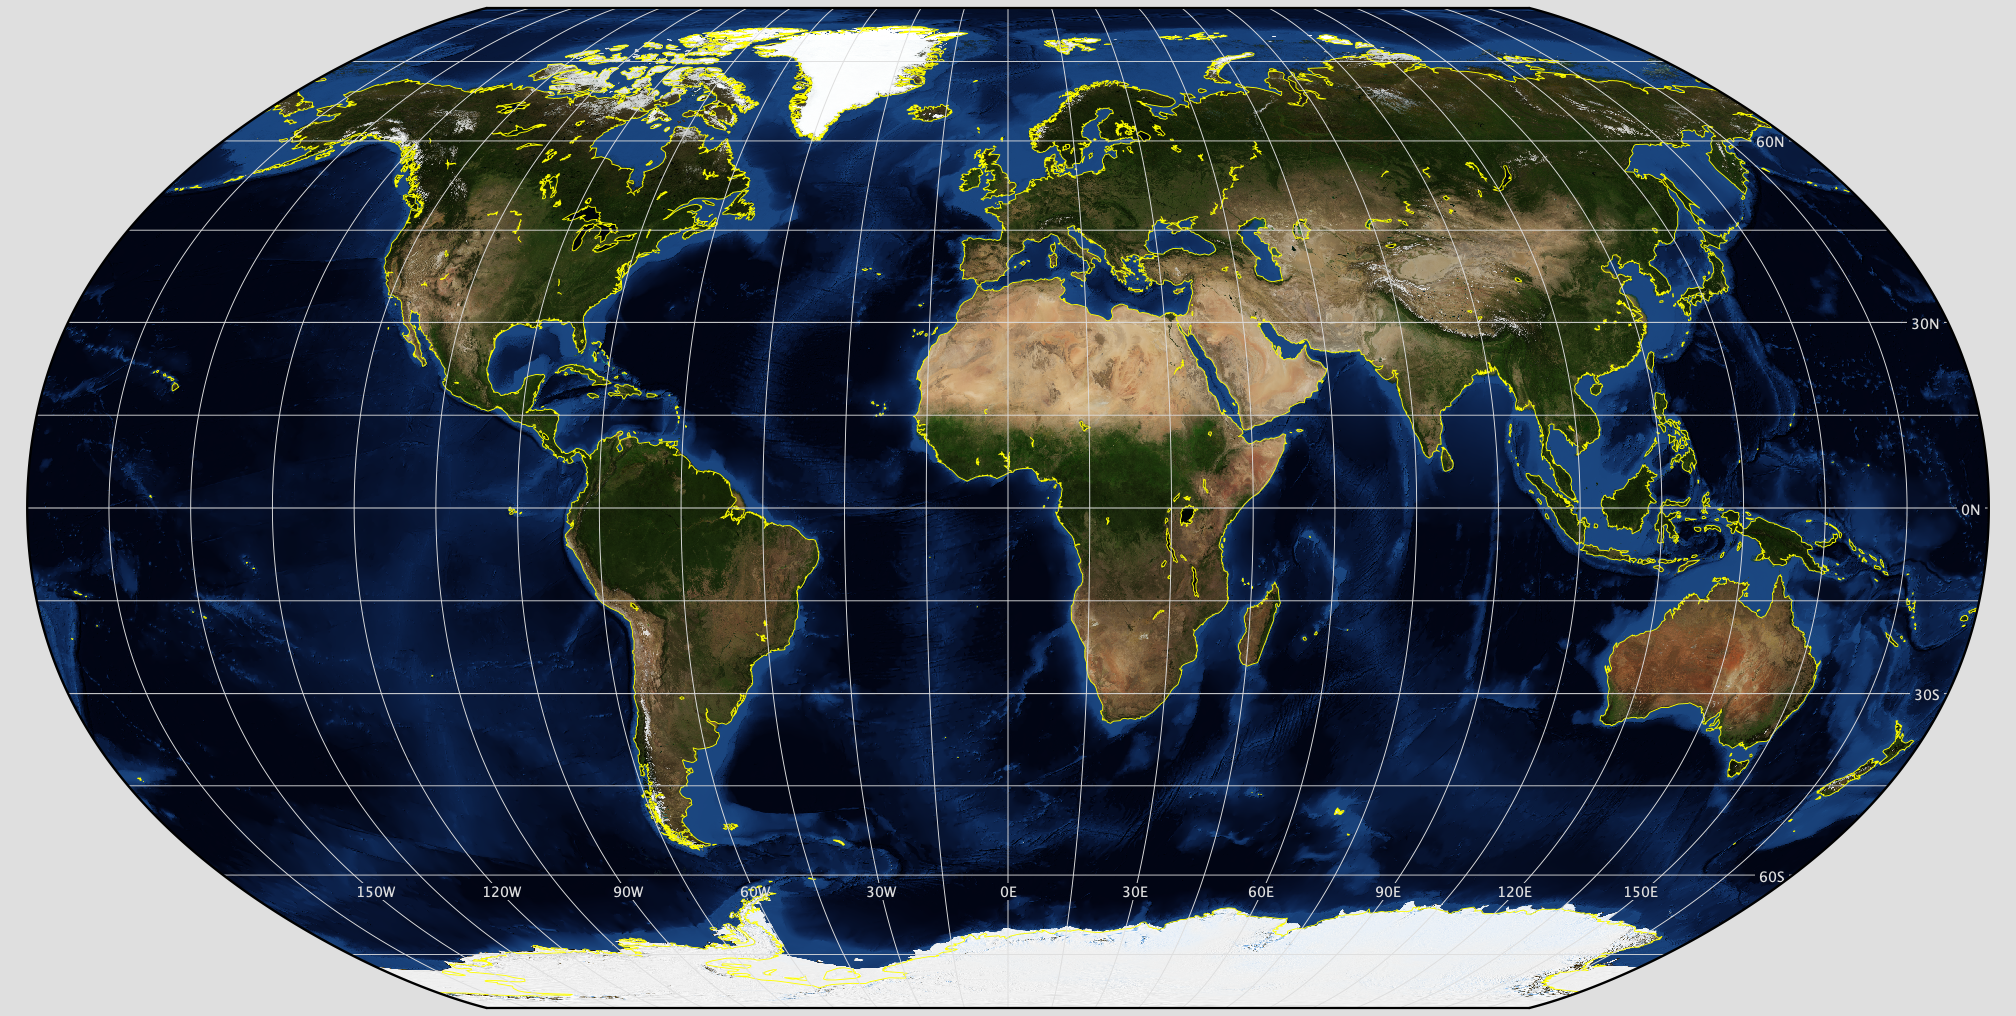
Figure 10.5. Robinson Projection
Credit: Image from Map Projection Explorer, NASA, public domain
10.3 Determining Distortions
A common method used to determine distortions on a map projection is to apply Tissot’s indicatrix. It is a concept developed by French cartographer Nicolas Auguste Tissot [7]. All maps distort at least one of the projection properties of shape, area, direction, and distance. Tissot’s indicatrix helps to quantify the distortion of the projection properties of shape and area as shown on the map.
Tissot’s indicatrix is composed of small circles centered at points on the Earth, typically at the intersection of lines of latitude and longitude. The Earth is then projected onto a map using a projection. We then consider the shape and area of the circles across the map surface to determine the amount and distribution of distortion [4].
There are three ways in which we can visualize distortions using Tissot’s indicatrix – size/area change, shape change, or both (Figure 10.6).

Figure 10.6. Changes that can be visualized using Tissot’s indicatrix.
Credit: Image created by Barbara Buttenfield, University of Colorado Boulder, used with permission
Conformal Projection: On a conformal map projection the circles will continue to be perfect circles, not changing in shape, but their size/area will vary over the map such as with the Mercator Projection (Figure 10.7) [4].
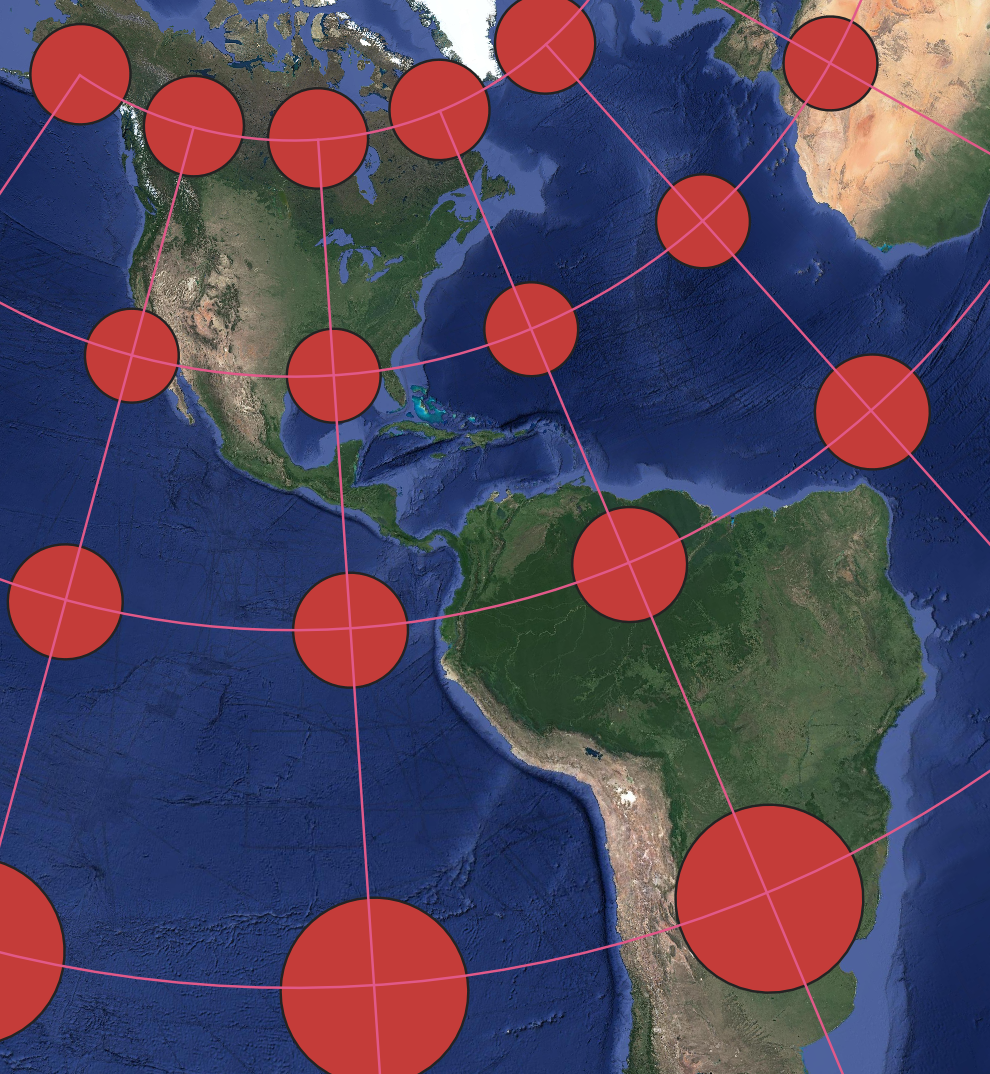
Figure 10.7. Lambert conformal conic projection with Tissot’s indicatrix showing size/area change only.
Data Source: Google Satellite Imagery accessed through QGIS.
Equal-Area Projection: On an equal-area map projection the circles will be transformed into ellipses but the area of the ellipses will be the same as the area of the original circles. That means although they will change shape they will not change in size/area such as with the World Equal Area projection (Figure 10.8) [4].

Figure 10.8. World Equal Area cylindrical projection with Tissot’s indicatrix showing shape change only.
Data Source: Google Satellite Imagery accessed through QGIS.
Compromise Projection: For a compromise projection, no property is preserved as it seeks to minimize distortion of all the map properties. Therefore, as can be seen on the Robinson projection (Figure 10.9), neither size/area nor shape is retained as evidenced by Tissot’s indicatrix [4].
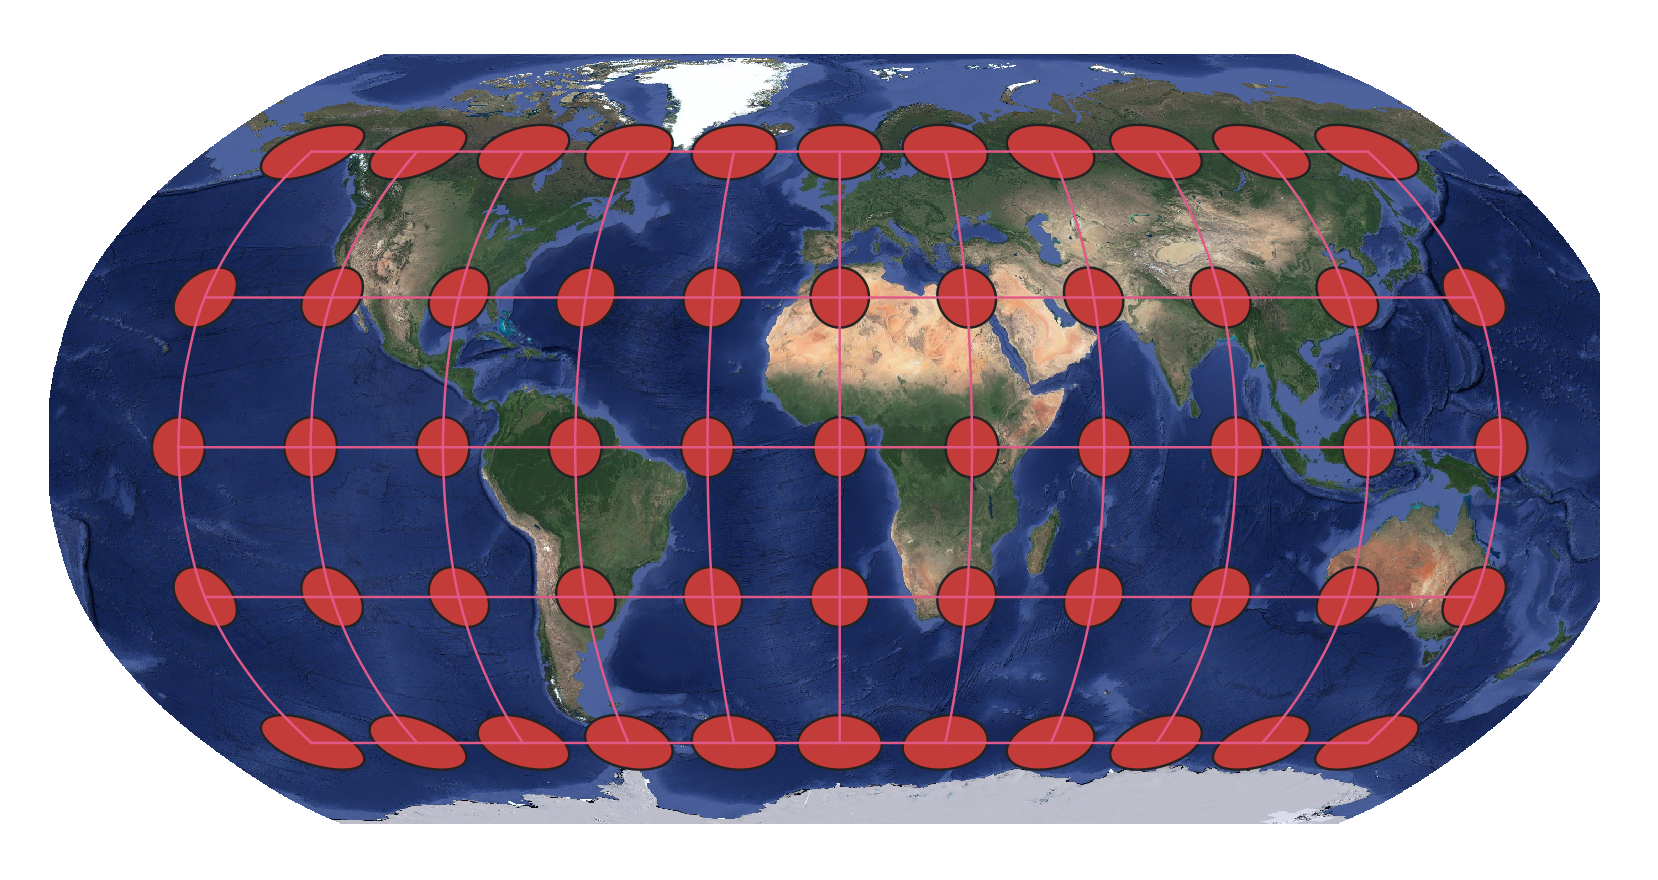
Figure 10.9. Robinson projection with Tissot’s indicatrix showing shape and size/area change.
Data Source: Google Satellite Imagery accessed through QGIS.
Equidistant and Equidirectional Projections: Both equidistant and equidirectional map projections sacrifice shape and area representations to preserve either distance or directional measurements, respectively. This can be observed on an equidistant conic projection (Figure 10.10) as neither size/area nor shape is retained as evidenced by Tissot’s indicatrix [4].
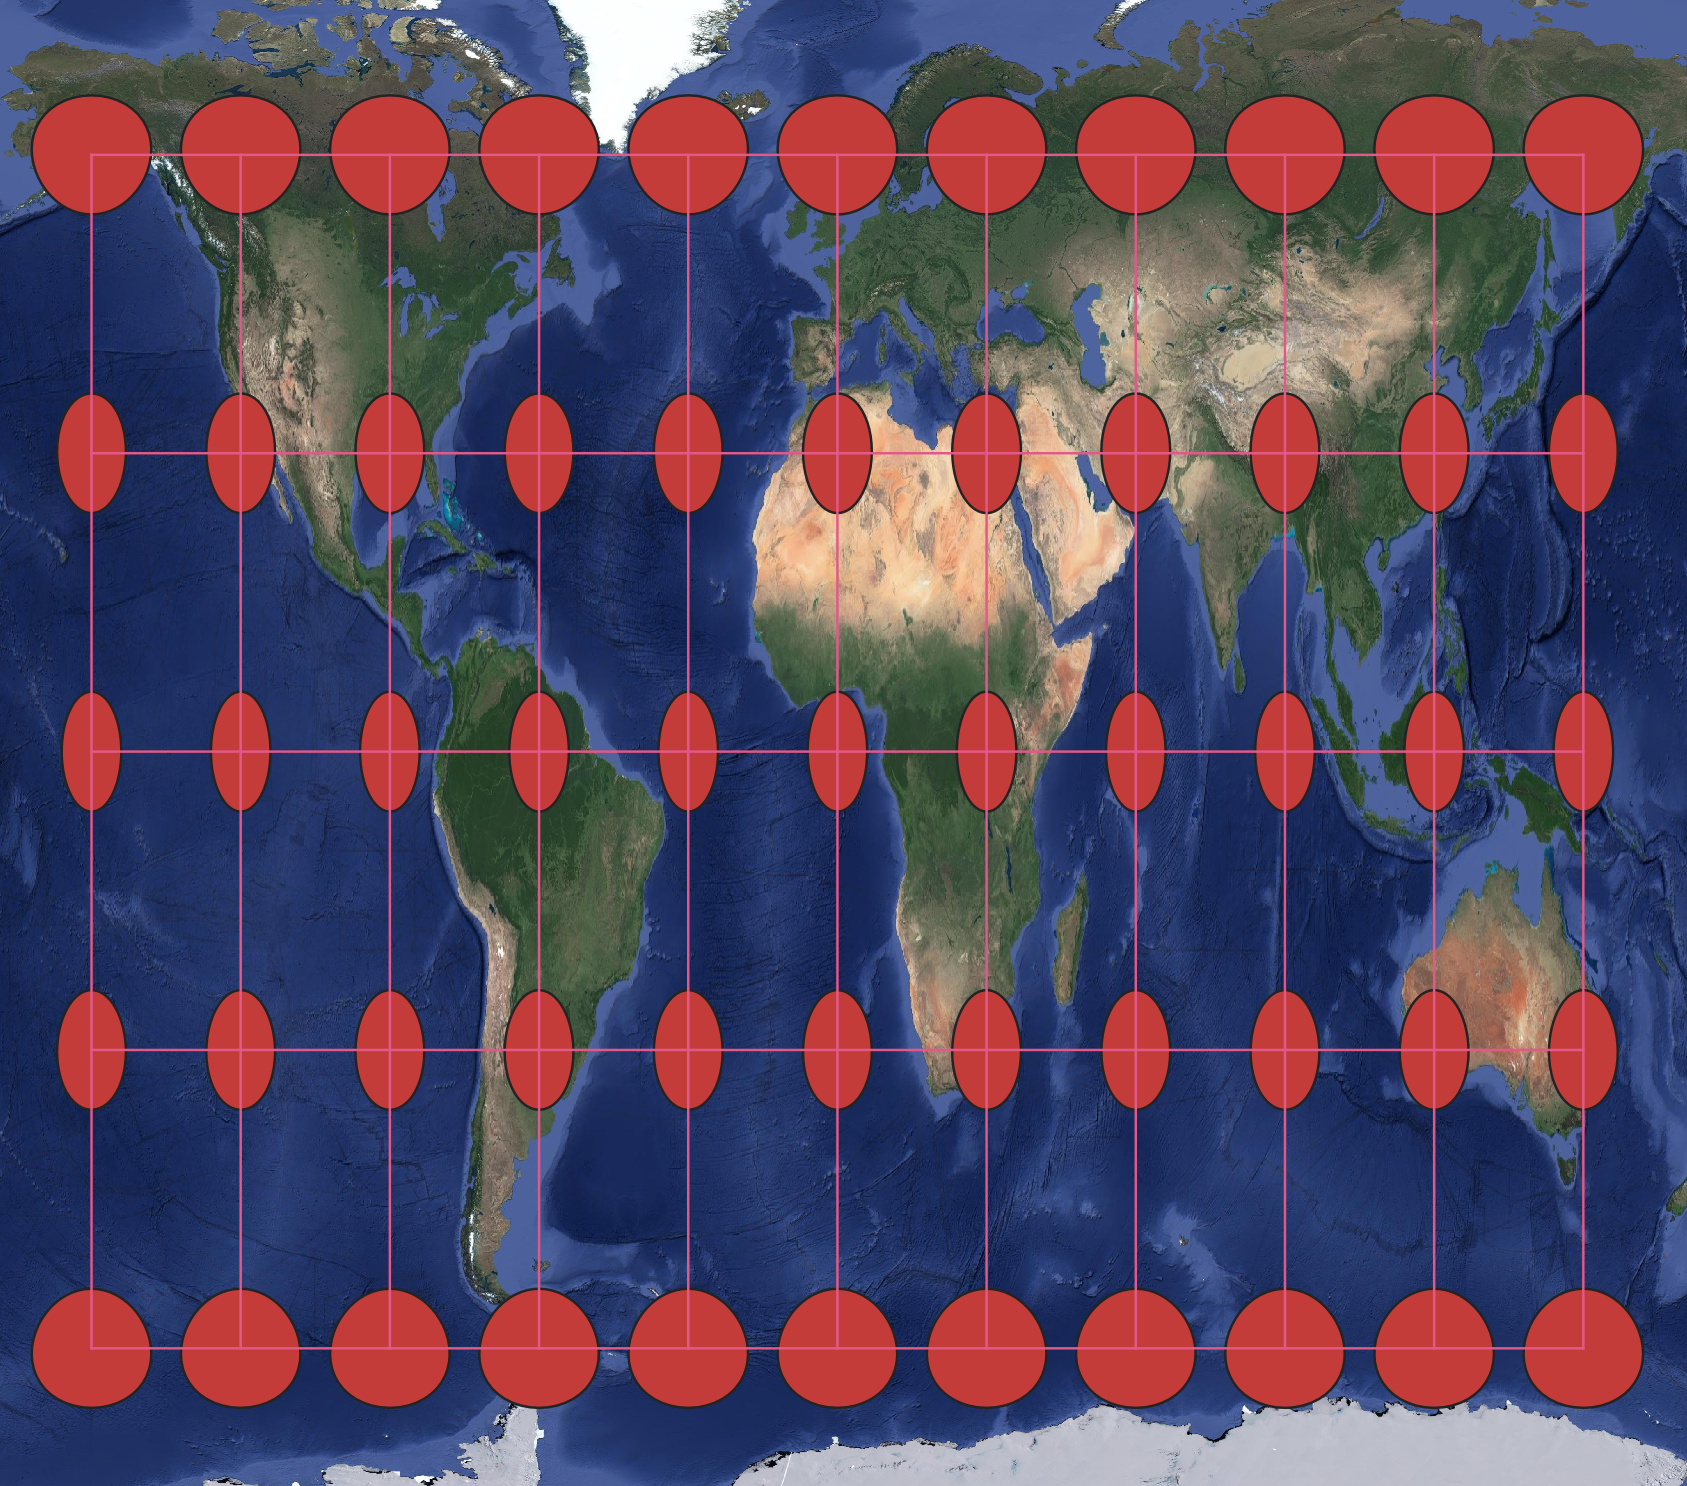
Figure 10.10. Equidistant projection with Tissot’s indicatrix showing both shape and size/area change.
Data Source: Google Satellite Imagery accessed through QGIS.
References – materials are adapted from the following sources:
[1] Essentials of Geographic Information Systems by Saylor Academy under a CC BY-NC-SA 3.0 license
[2] GEOG 486 Cartography and Visualization by Cary Anderson, Pennsylvania State University, under a CC BY-NC-SA 4.0 license.
[3] Geographic Information Systems and Cartography by Adam Dastrup under a CC BY-NC-SA 4.0 license
[4] Introduction to Cartography by Ulrike Ingram under a CC BY 4.0 license
[5] Introduction to GIS by Victor Olaya under a CC BY 3.0 license
[6] Mapping, Society, and Technology by Steven M. Manson under a CC BY-NC 4.0 license
Media Attributions
- Picture2
