5 Module Five: Execution, Monitoring and Controlling
Module Five: Execution, Monitoring and Controlling
Module Learning Objectives
- Discuss the resistance to safety measures seen in the construction industry. (CLO 1)
- Identify the status of a project in the executing phase. (CLO 1)
- Determine possible corrections necessary to keep a project on track during the Execution phase. (CLO 2)
- Identify stages of a construction project. (CLO 1, 2)
- Identify at least three things: the monitoring and controlling phase tracks. (CLO 2)
Module Essential Questions
- Why does resistance to safety measures persist in the construction industry, and how can it be effectively addressed to ensure a safer work environment? (CLO 1)
- How can the status of a construction project be accurately identified during the executing phase, and what indicators should project managers consider? (CLO 1)
- What are some common challenges that may arise during the execution phase of a construction project, and how can project managers determine and implement appropriate corrections to maintain project progress? (CLO 2)
- What are the key stages of a construction project, and how does understanding these stages contribute to effective project management? (CLO 1, 2)
- In the monitoring and controlling phase of a construction project, what are at least three critical aspects that project managers track, and how do these aspects influence project outcomes? (CLO 2)
Lesson 1: Executing Phase
The Executing Phase
During the execution phase of our project, all the plans start becoming a reality. We're executing contracts and prepping for work. We then go through a series of sub-phases to prepare the ground for and build the structure. The following readings will cover some of the productivity calculations that help us understand how quickly these sub-phases will run.
Site Utilization Planning
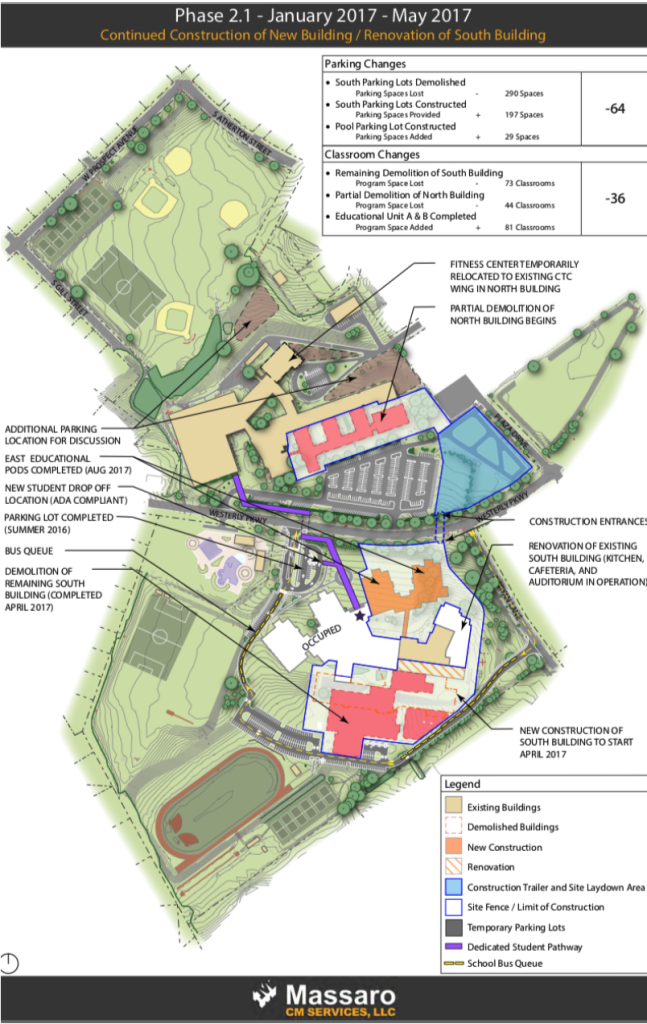
A site utilization plan documents the designed status of a project at a point in time. Site Utilization Plans are critical to defining the layout of a project site as it progresses through the construction process. The site is continuously changing. Therefore, no one representation represents the progression of the site throughout the construction process. But, instead, it is critical to have at least several site utilization plans to define the progress of the site, for example, a site utilization plan for the excavation phase, superstructure phase, enclosure phase, and finishes phase.
The checklist included below provides typical items that should be included in a Site Utilization Plan. Figure 5.1 shows an example of a site plan for a school project.
Site Utilization Plan Checklist
Documentation and Existing Conditions Requirement
- Developed as a clear plan view within a quality drawing application
- All building parameters are clearly shown (darker line weight)
- Building heights I number of stones are noted on the project building and adjacent buildings
- Clear labels on all existing and temporary facilities
- Property line/project boundaries are identified
- North arrow noted
- Existing and new utilities are clearly shown - water, sewer, electrical, natural gas, communication
- Fire hydrants
- Streetlights and other adjacent lighting
- Pedestrian and traffic patterns are clearly shown, along with any walkways I bike paths
- Document developed with clear fonts and professional graphical quality
- Clear Legend shows all items. Be careful with color since people may print in black & white.
Content for Site Logistics Plan for a Phase of Construction
- Crane locations and limits of crane shown for lifting capacity CM and subcontractor office trailers and tool trailer locations Entrance and exit to site (can one-way traffic be used?)
- Temporary support of excavation systems and limits of excavation
- Loading docks, material hoists, personnel hoists, temporary elevators (if used)
- Temporary systems - scaffolding, pre-assembly areas, shoring towers, materials
- Dumpsters, portable toilets, material storage sheds
- Note the phase of construction and scheduled dates in the title block
Optional Items Depending Upon Project / Purpose
- Parking for construction personnel
- Direction of workflow for crews (using arrows and appropriate Legend information)
- Vicinity Map with directions to and from the site for construction vehicles
- The 4D version of the site plan including the structure and neighboring buildings
Labor Productivity
Productivity in construction is often broadly defined as output per labor hour. Since labor constitutes a large part of the construction cost and the number of labor hours in performing a task in construction is more susceptible to the influence of management than materials or capital, this productivity measure is often referred to as labor productivity. However, it is important to note that labor productivity is a measure of the overall effectiveness of an operating system in utilizing labor, equipment, and capital to convert labor efforts into useful output, and is not a measure of the capabilities of labor alone. For example, by investing in a piece of new equipment to perform certain tasks in construction, output may be increased for the same number of labor hours, thus resulting in higher labor productivity.
Construction output may be expressed in terms of functional units or constant dollars. In the former case, labor productivity is associated with units of product per labor hour, such as cubic yards of concrete placed per hour or miles of highway paved per hour. In the latter case, labor productivity is identified with the value of construction (in constant dollars) per labor hour. The value of construction in this regard is not measured by the benefit of constructed facilities but by construction cost. Labor productivity measured in this way requires considerable care in interpretation. For example, wage rates in construction have been declining in the US during the period 1970 to 1990, and since wages are an important component in construction costs, the value of construction put in place per hour of work will decline as a result, suggesting lower productivity.
Productivity at the Job Site
Contractors and owners are often concerned with the labor activity at job sites. For this purpose, it is convenient to express labor productivity as functional units per labor hour for each type of construction task. However, even for such specific purposes, different levels of measure may be used. For example, cubic yards of concrete placed per hour is a lower level of measure than miles of highway paved per hour. Lower-level measures are more useful for monitoring individual activities, while higher-level measures may be more convenient for developing industry-wide standards of performance.
While each contractor or owner is free to use its system to measure labor productivity at a site, it is a good practice to set up a system that can be used to track productivity trends over time and in varied locations. Considerable efforts are required to collect information regionally or nationally over several years to produce such results. The productivity indices compiled from statistical data should include parameters such as the performance of major crafts, effects of project size, type and location, and other major project influences.
To develop industry-wide standards of performance, there must be a general agreement on the measures to be useful for compiling data. Then, the job site productivity data collected by various contractors and owners can be correlated and analyzed to develop certain measures for each of the major segments of the construction industry. Thus, a contractor or owner can compare its performance with that of the industry average.
Productivity in the Construction Industry
Because of the diversity of the construction industry, a single index for the entire industry is neither meaningful nor reliable. Productivity indices may be developed for major segments of the construction industry nationwide if reliable statistical data can be obtained for separate industrial segments. For this general type of productivity measure, it is more convenient to express labor productivity as constant dollars per labor hours since dollar values are more easily aggregated from a large amount of data collected from different sources. The use of constant dollars allows meaningful approximations of the changes in construction output from one year to another when price deflators are applied to current dollars to obtain the corresponding values in constant dollars. However, since most construction price deflators are obtained from a combination of price indices for material and labor inputs, they reflect only the change in price levels and do not capture any savings arising from improved labor productivity. Such deflators tend to overstate increases in construction costs over a long period and consequently understate the physical volume or value of construction work in years after the base year for the indices.
Factors Affecting Job-Site Productivity
Job-site productivity is influenced by many factors which can be characterized either as labor characteristics, project work conditions, or non-productive activities.
The labor characteristics include:
- age, skill, and experience of the workforce
- leadership and Motivation of the workforce
The project work conditions include among other factors:
- Job size and complexity.
- Job site accessibility.
- Labor availability.
- Equipment utilization.
- Contractual agreements.
- Local climate.
- Local cultural characteristics, particularly in foreign operations.
The non-productive activities associated with a project may or may not be paid by the owner, but they nevertheless take up potential labor resources that can otherwise be directed to the project.
The non-productive activities, among other factors, include:
- Indirect labor is required to maintain the progress of the project
- Rework for correcting unsatisfactory work
- Temporary work stoppage due to inclement weather or material shortage
- Time off for union activities
- Absentee time, including late start and early quit
- Non-working holidays
- Strikes
Each category of factors affects the productive labor available to a project as well as the on-site labor efficiency.
Test your Knowledge!
In the Executing Phase of a construction project, which plan is crucial for defining the layout of a project site as it progresses through construction?
Labor Characteristics
Performance analysis is a common tool for assessing worker quality and contribution. Factors that might be evaluated include:
-
Quality of Work - the caliber of work produced or accomplished.
-
Quantity of Work - volume of acceptable work
-
Job Knowledge - demonstrated knowledge of requirements, methods, techniques and skills involved in doing the job and in applying these to increase productivity.
-
Related Work Knowledge - knowledge of effects of work upon other areas and knowledge of related areas that influence assigned work.
-
Judgment - soundness of conclusions, decisions and actions.
-
Initiative - ability to take effective action without being told.
-
Resource Utilization - ability to delineate project needs and locate, plan and effectively use all resources available.
-
Dependability - reliability in assuming and carrying out commitments and obligations.
-
Analytical Ability - effectiveness in thinking through a problem and reaching sound conclusions.
-
Communicative Ability - effectiveness in using oral and written communications and in keeping subordinates, associates, superiors and others adequately informed.
-
Interpersonal Skills - effectiveness in relating appropriately and productively to others.
-
Ability to Work Under Pressure - ability to meet tight deadlines and adapt to changes.
-
Security Sensitivity - ability to handle confidential information appropriately and to exercise care in safeguarding sensitive information.
-
Safety Consciousness - knows good safety practices and demonstrates awareness of own personal safety and the safety of others.
-
Profit and Cost Sensitivity - ability to seek out, generate and implement profit-making ideas.
-
Planning Effectiveness - ability to anticipate needs, forecast conditions, set goals and standards, plan and schedule work and measure results.
-
Leadership - ability to develop in others the willingness and desire to work towards common objectives.
-
Delegating - effectiveness in delegating work appropriately.
-
Development People - ability to select, train and appraise personnel, set standards of performance, and motivate to grow in their capacity.
-
Diversity (Equal Employment Opportunity) - ability to be sensitive to the needs of minorities, females and other protected groups and to demonstrate affirmative action in responding to these needs.
These different factors can each be assessed on a three-point scale:
- Recognized strength
- Meets expectations
- Areas needing improvement.
Examples of work performance in these areas might also be provided.
Project Work Conditions
Job-site labor productivity can be estimated either for each craft (carpenter, bricklayer, etc.) or each type of construction (residential housing, processing plant, etc.) under a specific set of work conditions. A base labor productivity may be defined for a set of work conditions specified by the owner or contractor who wishes to observe and measure the labor performance over a period of time under such conditions. A labor productivity index may then be defined as the ratio of the job-site labor productivity under a different set of work conditions to the base labor productivity and is a measure of the relative labor efficiency of a project under this new set of work conditions.
The effects of various factors related to work conditions on a new project can be estimated in advance, some more accurately than others. For example, for very large construction projects, the labor productivity index tends to decrease as the project size and/or complexity increase because of logistic problems and the "learning" that the workforce must undergo before adjusting to the new environment. Job-site accessibility often may reduce the labor productivity index if the workers must perform their jobs in roundabout ways, such as avoiding traffic in repaving the highway surface or maintaining the operation of a plant during renovation. Labor availability in the local market is another factor. Shortage of local labor will force the contractor to bring in non-local labor or schedule overtime work or both. In either case, the labor efficiency will be reduced in addition to incurring additional expenses. The degree of equipment utilization and mechanization of a construction project clearly will have a direct bearing on job-site labor productivity. The contractual agreements play an important role in the utilization of union or non-union labor, the use of subcontractors and the degree of field supervision, all of which will impact job-site labor productivity. Since on-site construction essentially involves outdoor activities, the local climate will influence the efficiency of workers directly. In foreign operations, the cultural characteristics of the host country should be observed in assessing labor efficiency.
Non-Productive Activities
The non-productive activities associated with a project should also be examined to examine the productive labor yield, which is defined as the ratio of direct labor hours devoted to the completion of a project to the potential labor hours. The direct labor hours are estimated based on the best possible conditions at a job site by excluding all factors that may reduce the productive labor yield. For example, in the repaving of highway surface, the flagmen required to divert traffic represent indirect labor which does not contribute to the labor efficiency of the paving crew if the highway is closed to the traffic. Similarly, for large projects in remote areas, indirect labor may be used to provide housing and infrastructure for the workers hired to supply the direct labor for a project. The labor hours spent on rework to correct unsatisfactory original work represent extra time taken away from potential labor hours. The labor hours related to such activities must be deducted from the potential labor hours to obtain the actual productive labor yield.
Materials Management
Materials management is an important element in project planning and control. Materials represent a major expense in construction, so minimizing procurement or purchase costs presents important opportunities for reducing costs. Poor materials management can also result in large and avoidable costs during construction. First, if materials are purchased early, capital may be tied up and interest charges incurred on the excess inventory of materials. Even worse, materials may deteriorate during storage or be stolen unless special care is taken. For example, electrical equipment often must be stored in waterproof locations. Second, delays and extra expenses may be incurred if materials required for particular activities are not available. Accordingly, ensuring a timely flow of material is an important concern of project managers.
Materials management is not just a concern during the monitoring stage in which construction is taking place. Decisions about material procurement may also be required during the initial planning and scheduling stages. For example, activities can be inserted in the project schedule to represent the purchasing of major items such as elevators for buildings. The availability of materials may greatly influence the schedule in projects with a fast track or very tight schedule: sufficient time for obtaining the necessary materials must be allowed. In some cases, more expensive suppliers or shippers may be employed to save time. Materials management is also a problem at the organizational level if central purchasing and inventory control is used for standard items. In this case, the various projects undertaken by the organization would present requests to the central purchasing group. In turn, this group would maintain inventories of standard items to reduce the delay in providing material or to obtain lower costs due to bulk purchasing. This organizational materials management problem is analogous to inventory control in any organization facing continuing demand for particular items.
Materials ordering problems lend themselves particularly well to computer-based systems to ensure the consistency and completeness of the purchasing process. In the manufacturing realm, the use of automated materials requirements planning systems is common. In these systems, the master production schedule, inventory records, and product component lists are merged to determine what items must be ordered, when they should be ordered, and how much of each item should be ordered in each period. The heart of these calculations is simple arithmetic: the projected demand for each material item in each period is subtracted from the available inventory. When the inventory becomes too low, a new order is recommended. For items that are non-standard or not kept in inventory, the calculation is even simpler since no inventory must be considered. With a materials requirement system, much of the detailed record-keeping is automated and project managers are alerted to purchasing requirements.
Example 5.1: Benefits of Materials Management Systems
From a study of twenty heavy construction sites, the following benefits from the introduction of materials management systems were noted:
- In one project, a 6% reduction in craft labor costs occurred due to the improved availability of materials as needed on-site. On other projects, an 8% savings due to reduced delay for materials was estimated.
- A comparison of two projects with and without a materials management system revealed a change in productivity from 1.92 man-hours per unit without a system to 1.14 man-hours per unit with a new system. Again, much of this difference can be attributed to the timely availability of materials.
- Warehouse costs were found to decrease 50% on one project with the introduction of improved inventory management, representing a savings of $ 92,000. Interest charges for inventory also declined, with one project reporting a cash flow savings of $ 85,000 from improved materials management.
Against these various benefits, the costs of acquiring and maintaining a materials management system have to be compared. However, management studies suggest that investment in such systems can be quite beneficial.
Material Procurement and Delivery
The main sources of information for feedback and control of material procurement are requisitions, bids and quotations, purchase orders and subcontracts, shipping and receiving documents, and invoices. For projects involving the large-scale use of critical resources, the owner may initiate the procurement procedure even before the selection of a constructor in order to avoid shortages and delays. Under ordinary circumstances, the constructor will handle the procurement to shop for materials with the best price/performance characteristics specified by the designer. Some overlapping and re-handling in the procurement process is unavoidable, but it should be minimized to ensure timely delivery of the materials in good condition.
The materials for delivery to and from a construction site may be broadly classified as (1) bulk materials, (2) standard off-the-shelf materials, and (3) fabricated members or units. The process of delivery, including transportation, field storage, and installation will be different for these classes of materials. The equipment needed to handle and haul these classes of materials will also be different.
Bulk materials refer to materials in their natural or semi-processed state, such as earthwork to be excavated, wet concrete mix, etc. which are usually encountered in large quantities in construction. Some bulk materials such as earthwork or gravel may be measured in bank (solid in situ) volume. The quantities of materials for delivery may be substantially different when expressed in different measures of volume, depending on the characteristics of such materials.
Standard piping and valves are typical examples of standard off-the-shelf materials that are used extensively in the chemical processing industry. Since standard off-the-shelf materials can easily be stockpiled, the delivery process is relatively simple.
Fabricated members such as steel beams and columns for buildings are pre-processed in a shop to simplify the field erection procedures. Welded or bolted connections are attached partially to the members which are cut to precise dimensions for adequate fit. Similarly, steel tanks and pressure vessels are often partly or fully fabricated before shipping to the field. In general, if the work can be done in the shop where working conditions can better be controlled, it is advisable to do so, provided that the fabricated members or units can be shipped to the construction site satisfactorily at a reasonable cost.
As a further step to simplify field assembly, an entire wall panel including plumbing and wiring or even an entire room may be prefabricated and shipped to the site. While the field labor is greatly reduced in such cases, "materials" for delivery are manufactured products with value added by another type of labor. With modern means of transporting construction materials and fabricated units, the percentages of costs on direct labor and materials for a project may change if more prefabricated units are introduced in the construction process.
In the construction industry, materials used by a specific craft are generally handled by craftsmen, not by general labor. Thus, electricians handle electrical materials, pipefitters handle pipe materials, etc. This multiple handling diverts scarce skilled craftsmen and contractor supervision into activities that do not directly contribute to the construction. Since contractors are not normally in the freight business, they do not perform the tasks of freight delivery efficiently. All these factors tend to exacerbate the problems of freight delivery for very large projects.
Inventory Control
Once goods are purchased, they represent an inventory used during the construction process. The general objective of inventory control is to minimize the total cost of keeping the inventory while making tradeoffs among the major categories of costs:
- Purchase Costs
- Order Costs
- Holding Costs
- Unavailable Costs.
These cost categories are interrelated since reducing costs in one category may increase costs in others. The costs in all categories generally are subject to considerable uncertainty.
Purchase Costs
The purchase cost of an item is the unit purchase price from an external source including transportation and freight costs. For construction materials, it is common to receive discounts for bulk purchases, so the unit purchase cost declines as quantity increases. These reductions may reflect manufacturers' marketing policies, economies of scale in material production, or scale economies in transportation. There are also advantages in having homogeneous materials. For example, a bulk order to ensure the same color or size of items such as bricks may be desirable. Accordingly, it is usually desirable to make a limited number of large purchases for materials. In some cases, organizations may consolidate small orders from several different projects to capture such bulk discounts; this is a basic saving to be derived from a central purchasing office.
The cost of materials is based on prices obtained through effective bargaining. Unit prices of materials depend on bargaining leverage, quantities, and delivery time. Organizations with the potential for long-term purchase volume can command better bargaining leverage. While orders in large quantities may result in lower unit prices, they may also increase holding costs and thus cause problems in cash flow. Requirements for short delivery time can also adversely affect unit prices. Furthermore, design characteristics that include items of odd sizes or shapes should be avoided. Since such items normally are not available in the standard stockpile, purchasing them causes higher prices.
The transportation costs are affected by shipment sizes and other factors. Shipment by the full load of a carrier often reduces prices and assures quicker delivery, as the carrier can travel from the origin to the destination of the full load without having to stop to deliver part of the cargo at other stations. Avoiding transshipment is another consideration in reducing shipping costs. While the reduction in shipping costs is a major objective, the requirements of delicate handling of some items may favor a more expensive mode of transportation to avoid breakage and replacement costs.
Order Cost
The order cost reflects the administrative expense of issuing a purchase order to an outside supplier. Order costs include expenses of making requisitions, analyzing alternative vendors, writing purchase orders, receiving materials, inspecting materials, checking on orders, and maintaining records of the entire process. Order costs are usually only a small portion of total costs for material management in construction projects, although ordering may require substantial time.
Holding Costs
The holding costs or carrying costs are primarily the result of capital costs, handling, storage, obsolescence, shrinkage, and deterioration. Capital cost results from the opportunity cost or financial expense of capital tied up in inventory. Once payment for goods is made, borrowing costs are incurred or capital must be diverted from other productive uses. Consequently, a capital carrying cost is incurred equal to the value of the inventory during a period multiplied by the interest rate obtainable or paid during that period. Note that capital costs only accumulate when payment for materials occurs; many organizations attempt to delay payments as long as possible to minimize such costs. Handling and storage represent the movement and protection charges incurred for materials. Storage costs also include the disruption caused to other project activities by large inventories of materials that get in the way. Obsolescence is the risk that an item will lose value because of changes in specifications. Shrinkage is the decrease in inventory over time due to theft or loss. Deterioration reflects a change in material quality due to age or environmental degradation. Many of these holding cost components are difficult to predict in advance; a project manager knows only that there is some chance that specific categories of cost will occur. In addition to these major categories of cost, there may be ancillary costs of additional insurance, taxes (many states treat inventories as taxable property), or additional fire hazards. As a general rule, holding costs will typically represent 20 to 40% of the average inventory value over a year; thus if the average material inventory on a project is $ 1 million over a year, the holding cost might be expected to be $200,000 to $400,000.
Unavailability Cost
The unavailability cost is incurred when a desired material is not available at the desired time. In manufacturing industries, this cost is often called the stockout or depletion cost. Shortages may delay work, thereby wasting labor resources or delaying the completion of the entire project. Again, it may be difficult to forecast in advance exactly when an item may be required or when a shipment will be received. While the project schedule gives one estimate, deviations from the schedule may occur during construction. Moreover, the cost associated with a shortage may also be difficult to assess; if the material used for one activity is not available, it may be possible to assign workers to other activities, and, depending upon which activities are critical, the project may not be delayed.
Lesson 2: Health and Safety
All accidents/incidents affect the bottom line (profit). Accidents/incidents are those occurrences that result in loss of production, illness or injury, damage to equipment or property, and near misses. Incidents cannot just be measured simply in workers’ compensation costs. These incidents damage the continuity of the job site, which causes lost time, lost wages, the breakup of a crew or the loss of a key person, property loss in the form of damage to machines and equipment, and culminates in the supervisor’s time lost during an incident investigation or an OSHA investigation/inspection which results in the cost of citations and violations, as well as the cost in the form of legal issues and fees. Also, insurance premiums, as well as worker’s compensation experience rates, will be increased. There is also the cost of damaged property, new procedures, new equipment, labor issues, and the contractors’ valuable time. As can be seen, the cost of accidents/incidents is not fully measurable, but the picture is very clear. These costs can impact the efficiency and effectiveness of a construction operation but oftentimes could be avoided by giving safety and health some attention and support on construction job sites.
Quality and Safety Concerns in Construction
Quality control and safety represent increasingly important concerns for project managers. Defects or failures in constructed facilities can result in very large costs. Even with minor defects, re-construction may be required and facility operations impaired. Increased costs and delays are the result. In the worst case, failures may cause personal injuries or fatalities. Accidents during the construction process can similarly result in personal injuries and large costs. Indirect costs of insurance, inspection, and regulation are increasing rapidly due to these increased direct costs. Good project managers try to ensure that the job is done right the first time and that no major accidents occur on the project.
As with cost control, the most important decisions regarding the quality of a completed facility are made during the design and planning stages rather than during construction. It is during these preliminary stages that component configurations, material specifications, and functional performance are decided. Quality control during construction consists largely of ensuring conformance to these original design and planning decisions.
While conformance to existing design decisions is the primary focus of quality control, there are exceptions to this rule. First, unforeseen circumstances, incorrect design decisions, or changes desired by an owner in the facility function may require re-evaluation of design decisions during construction. While these changes may be motivated by the concern for quality, they represent occasions for re-design with all the attendant objectives and constraints. As a second case, some designs rely upon informed and appropriate decision-making during the construction process itself. For example, some tunneling methods make decisions about the amount of shoring required at different locations based on observation of soil conditions during the tunneling process. Since such decisions are based on better information concerning actual site conditions, the facility design may be more cost-effective as a result. With the attention to conformance as the measure of quality during the construction process, the specification of quality requirements in the design and contract documentation becomes extremely important. Quality requirements should be clear and verifiable so that all parties in the project can understand the requirements for conformance. Much of the discussion in this chapter relates to the development and the implications of different quality requirements for construction as well as the issues associated with ensuring conformance.
Safety during the construction project is also influenced in large part by decisions made during the planning and design process. Some designs or construction plans are inherently difficult and dangerous to implement, whereas other, comparable plans may considerably reduce the possibility of accidents. For example, clear separation of traffic from construction zones during roadway rehabilitation can greatly reduce the possibility of accidental collisions. Beyond these design decisions, safety largely depends upon education, vigilance, and cooperation during the construction process. Workers should be constantly alert to the possibilities of accidents and avoid taking unnecessary risks.
Organizing for Quality and Safety
A variety of different organizations are possible for quality and safety control during construction. One common model is to have a group responsible for quality assurance and another group primarily responsible for safety within an organization. In large organizations, departments dedicated to quality assurance and safety might assign specific individuals to assume responsibility for these functions on particular projects. For smaller projects, the project manager or an assistant might assume these and other responsibilities. In either case, ensuring safe and quality construction is a concern of the project manager in overall charge of the project in addition to the concerns of personnel, cost, time, and other management issues.
Inspectors and quality assurance personnel will be involved in a project to represent a variety of different organizations. Each of the parties directly concerned with the project may have its own quality and safety inspectors, including the owner, the engineer/architect, and the various construction firms. These inspectors may be contractors from specialized quality assurance organizations. In addition to on-site inspections, samples of materials will commonly be tested by specialized laboratories to ensure compliance. Inspectors to ensure compliance with regulatory requirements will also be involved. Common examples are inspectors for the local government's building department, for environmental agencies, and for occupational health and safety agencies.
The construction industry employs about 6% of the American workforce. However, according to the National Safety Council, the industry has the worst safety record of any industry in terms of worker deaths per 100,000 full-time equivalent workers. The record translates into 12 deaths every day. The Construction Industry Institute estimates the direct and indirect costs of construction accidents may be as high as $17 billion annually. Construction’s “Fatal Four” responsible for more than half (57.7%) of construction worker deaths in 2013 are:
- Falls—(36.5%)
- Struck by Object—(10.1%)
- Electrocutions—(8.6%)
- Caught-in/between—(2.5%)
The safety of those on the construction site and the safety of the adjacent public is of paramount importance. No one wants to die on a project or cause someone else to be killed because of their actions or lack of vigilance. It is necessary to develop and maintain a safety culture and safety must be part of machine utilization and work process planning. It is the responsibility of construction managers to create safety programs to prevent accidents. The key is to provide leadership for the creation of a safe work environment.
Over 45 years ago Congress began an investigation of construction safety, and in 1970, it enacted the Williams-Steiger Act, more commonly referred to as the Occupational Safety and Health Act. The act provided a comprehensive set of safety rules and regulations, inspection procedures, and safety recordkeeping requirements. It imposed nationwide safety standards on the construction industry. The Act also permits states to enact their own OSHA legislation as long as the state legislation is at least as stringent as the federal legislation. Under the OSHA Act, employers are required to provide their employees with a safe place to work and to maintain extensive safety records.
The Act established the Occupational Safety and Health Administration (OSHA), with regional offices in cities throughout the country. OSHA is responsible for the administration of the legislation and the development of rules and regulations to implement the act. The OSHA rules and regulations are published in the Federal Register. OSHA Safety and Health Standards, Code of Federal Regulations, Title 29, Part 1910, details safety features an architect or engineer must include in a project. The Construction and Health Regulations, Code of Federal Regulations, Part 1926, pertains specifically to construction contractors and construction work. The act provides both civil and criminal penalties for violations of OSHA regulations. The civil penalty for failure to correct a violation is $7,000 per day with a maximum penalty of $70,000. Criminal penalties can include both fines and imprisonment. OSHA intends to establish a uniform set of safety standards for construction operations and to enforce those standards actively. Contractors must maintain a current, up-to-date file of OSHA regulations and work proactively to comply with OSHA requirements.
The US Occupational Safety and Health Administration (OSHA) routinely conducts site visits of workplaces in conjunction with approved state inspection agencies. OSHA inspectors are required by law to issue citations for all standard violations observed. Safety standards prescribe a variety of mechanical safeguards and procedures; for example, ladder safety is covered by over 140 regulations. In cases of extreme non-compliance with standards, OSHA inspectors can stop work on a project. However, only a small fraction of construction sites are visited by OSHA inspectors and most construction site accidents are not caused by violations of existing standards. As a result, safety is largely the responsibility of the managers on-site rather than that of public inspectors.
While the multitude of participants involved in the construction process require the services of inspectors, it cannot be emphasized too strongly that inspectors are only a formal check on quality control. Quality control should be a primary objective for all the members of a project team. Managers should take responsibility for maintaining and improving quality control. Employee participation in quality control should be sought and rewarded, including the introduction of new ideas. Most important of all, quality improvement can catalyze improved productivity. By suggesting new work methods, avoiding rework, and avoiding long-term problems, good quality control can pay for itself. Owners should promote good quality control and seek out contractors who maintain such standards.
In addition to the various organizational bodies involved in quality control, issues of quality control arise in virtually all the functional areas of construction activities. For example, insuring accurate and useful information is an important part of maintaining quality performance. Other aspects of quality control include document control (including changes during the construction process), procurement, field inspection and testing, and final checkout of the facility.
Safety
Construction is a relatively hazardous undertaking. There are significantly more injuries and lost workdays due to injuries or illnesses in construction than in virtually any other industry. These work-related injuries and illnesses are exceedingly costly. The Construction Industry Cost Effectiveness Project estimated that accidents cost $8.9 billion or nearly seven percent of the $137 billion (in 1979 dollars) spent annually for industrial, utility, and commercial construction in the United States. Included in this total are direct costs (medical costs, premiums for workers' compensation benefits, liability, and property losses) as well as indirect costs (reduced worker productivity, delays in projects, administrative time, and damage to equipment and the facility). In contrast to most industrial accidents, innocent bystanders may also be injured by construction accidents. Several crane collapses from high-rise buildings under construction have resulted in fatalities to passersby. Prudent project managers and owners would like to reduce accidents, injuries, and illnesses as much as possible.
As with all the other costs of construction, it is a mistake for owners to ignore a significant category of costs such as injury and illnesses. While contractors may pay insurance premiums directly, these costs are reflected in bid prices or contract amounts. Delays caused by injuries and illnesses can present significant opportunity costs to owners. In the long run, the owners of constructed facilities must pay all the costs of construction. For the case of injuries and illnesses, this general principle might be slightly qualified since significant costs are borne by workers themselves or society at large. However, court judgments and insurance payments compensate for individual losses and are ultimately borne by the owners.
The causes of injuries in construction are numerous. The largest single category for both injuries and fatalities is individual falls. Handling goods and transportation are also a significant cause of injuries. From a management perspective, however, these reported causes do not provide a useful prescription for safety policies. An individual fall may be caused by a series of coincidences: a railing might not be secure, a worker might be inattentive, the footing may be slippery, etc. Removing any one of these compound causes might serve to prevent any particular accident. However, conditions such as unsecured railings will normally increase the risk of accidents.
Some safety and health factors are unique to construction and some that are not. Awareness of these factors will help in preventing the occurrence of occupationally related-construction incidents.
- Actual physical hazards such as an unstable wall that is being erected.
- Environmental hazards such as toxic atmospheres, oxygen deficiency, noise, radiation, and dust.
- Human factors such as a supervisor’s or worker’s failure to follow safe work practices.
- Lack of or poorly designed safety standards such as no standard for confined space entry or a construction standard or a chemical that is never used in the construction industry.
- Failure to communicate within a single trade such as one equipment operator not following the standard travel way rules and colliding with another operator’s equipment, resulting in potential injuries and damage.
- Failure to communicate between two or more trades such as a crane operator contacting high voltage lines while another trade (construction worker) is guiding the piece with a tagline on the material being hoisted.
The occurrence of traumatic occupational fatalities is unique in that they provide readily accessible information as to their cause and prevention. This is very different than occupational illnesses, which often have a long latency period between exposure and symptoms. There are many reasons why dealing with traumatic deaths has advantages such as:
- Deaths occur in real-time with no latency period; thus, an immediate sequence of events exists.
- The events are usually readily observable, and the reconstruction of minutes or hours rather than days, months, or years is an advantage.
- The roots of basic causes are more clearly identified.
- It is easier to detect cause-and-effect relationships.
- There is no difficulty in diagnosing the outcome (death).
- In most cases, traumatic deaths are highly preventable.
Various measures are available to improve job site safety in construction. Several of the most important occur before construction is undertaken. These include design, choice of technology, and education. By altering facility designs, particular structures can be safer or more hazardous to construct. For example, parapets can be designed to appropriate heights for construction worker safety, rather than the minimum height required by building codes.
The choice of technology can also be critical in determining the safety of a job site. Safeguards built into machinery can notify operators of problems or prevent injuries. For example, simple switches can prevent equipment from operating when protective shields are not in place. With the availability of onboard electronics (including computer chips) and sensors, the possibilities for sophisticated machine controllers and monitors have greatly expanded for construction equipment and tools. Materials and work process choices also influence the safety of construction. For example, the substitution of alternative materials for asbestos can reduce or eliminate the prospects of long-term illnesses such as asbestosis.
Educating workers and managers on proper procedures and hazards can have a direct impact on job site safety. The realization of the large costs involved in construction injuries and illnesses provides considerable motivation for awareness and education. Regular safety inspections and safety meetings have become standard practices on most job sites.
Pre-qualification of contractors and sub-contractors concerning safety is another important avenue for safety improvement. If contractors are only invited to bid or enter negotiations if they have an acceptable record of safety (as well as quality performance), then a direct incentive is provided to ensure adequate safety on the part of contractors.
During the construction process itself, the most important safety-related measures are to ensure vigilance and cooperation on the part of managers, inspectors, and workers. Vigilance involves considering the risks of different working practices. It also involves maintaining temporary physical safeguards such as barricades, braces, guidelines, railings, toe boards, and the like. Sets of standard practices are also important, such as:
- requiring hard hats on site.
- requiring eye protection on site.
- requiring hearing protection near loud equipment.
- insuring safety shoes for workers.
- providing first-aid supplies and trained personnel on-site
While eliminating accidents and work-related illnesses is a worthwhile goal, it will never be attained. Construction has many characteristics making it inherently hazardous. Large forces are involved in many operations. The job site is continually changing as construction proceeds. Workers do not have fixed worksites and must move around a structure under construction. The tenure of a worker on a site is short, so the worker's familiarity and the employer-employee relationship are less settled than in manufacturing settings. Despite these peculiarities and as a result of exactly these special problems, improving worksite safety is a very important project management concern.
Test your Knowledge!
Which of the following is NOT one of construction's "Fatal Four"?
a. Falls
b. Electrocutions
c. Struck by Object
d. Noise Pollution
Example 5.2: Trench Collapse
To replace 1,200 feet of a sewer line, a trench of between 12.5 and 18 feet deep was required down the center of a four-lane street. The contractor chose to begin excavation of the trench from the shallower end, requiring a 12.5-deep trench. Initially, the contractor used a nine-foot high, four-foot-wide steel trench box for soil support. A trench box is a rigid steel frame consisting of two walls supported by welded struts with open sides and ends. This method had the advantage that traffic could be maintained in at least two lanes during the reconstruction work.
In the shallow parts of the trench, the trench box seemed to adequately support the excavation. However, as the trench got deeper, more soil was unsupported below the trench box. Intermittent soil collapses in the trench began to occur. Eventually, an old parallel six-inch water main collapsed, thereby saturating the soil and leading to massive soil collapse at the bottom of the trench. Replacement of the water main was added to the initial contract. At this point, the contractor began sloping the sides of the trench, thereby requiring the closure of the entire street.
The initial use of the trench box was convenient, but it was inadequate and unsafe. Workers in the trench were in continuing danger of accidents stemming from soil collapse. Disruption to surrounding facilities such as the parallel water main was highly likely. Adoption of a tongue and groove vertical sheeting system over the full height of the trench or the sloping excavation eventually is preferable.
Stop and Reflect 5.1
Overview
According to OSHA, construction is a high-hazard industry that comprises a wide range of activities involving construction, alteration, and/or repair. Construction workers engage in many activities that may expose them to serious hazards, such as falling from rooftops, unguarded machinery, being struck by heavy construction equipment, electrocutions, silica dust, and asbestos. Despite the safety measures in place, construction still has one of the highest fatality rates as an industry.
Objective: As it will undoubtedly be tested in the field, this reflection is meant to get you thinking about your stance on safety culture in the construction industry.
Instructions
Please choose and answer 3 of the following questions:
- If construction is such a high-hazard industry, why is it so difficult to get employees to adhere to safety protocols?
- What causes them to make conscious decisions that could kill them?
- Why do some construction workers resist the use of safety equipment such as hard hats and fall protection harnesses?
- Why does the practice of resisting the use of safety equipment persist?
- What should be done about it?
- Have you seen this in your own experiences, and if so what is your opinion on it?
Evaluation
Your work will be assessed based on the following criteria:
- Answered three of the listed questions.
- It is clear which questions were chosen and answered.
- Depth and clarity of work
- Comprehension of construction health and safety
Lesson 3: Monitoring and Controlling
The Monitoring and Controlling phase ensures that a project adheres to its plan, allowing for necessary adjustments to keep the project on track. We'll cover the essential techniques and metrics used in this phase, the process of reporting progress and variances, and how changes, including schedule compressions, are managed effectively.
Project Management During Monitoring & Controlling
The essence of monitoring and controlling lies in:
- Following the plans established during the planning phase.
- Tracking progress to ensure alignment with the project's schedule and budget.
- Managing changes effectively to adapt to new challenges and requirements as they arise.
Reporting Progress: Earned Value Management Value Management (EVM) is a key tool in this phase, incorporating various metrics to assess project performance:
- Budgeted Cost of Work Scheduled (BCWS/PV): The total budgeted cost as of a certain date.
- Earned Value (EV): The value of work completed compared to the planned budget.
- Actual Cost (AC): The actual expenses incurred for the completed work.
- Budget at Completion (BAC): The total budget for the entire project.
Variance Analysis
Two critical variances are monitored:
- Schedule Variance (SV): SV = EV - PV. Indicates whether the project is ahead, on, or behind schedule.
- Cost Variance (CV): CV = EV - AC. Reflects whether the project is under or over budget.
Change Control Process
Managing changes involve a structured process established during the planning phase, including:
- Scope, process, and schedule adjustments.
- A change request and approval process to document and authorize changes.
- A tracking system to monitor the status and impact of changes.
Schedule Compression
When projects need to accelerate, two strategies are employed:
- Crashing: Adding more resources to critical tasks, increases costs.
- Fast-Tracking: Adjusting the project schedule to undertake tasks in parallel, increasing risks and potential for rework.
Test Your Knowledge!
What describes the purpose of Earned Value Management (EVM) in project management?
During the project execution phase, there is a constant influx of status reports to the project management team. These reports then need to be understood and interpreted to better understand the current state of the project's progress. The main focuses of these reports are typically cost and schedule. The following reading goes into further detail about forecasting and controlling project costs as well as the project schedule.
The Cost Control Problem
During the execution of a project, procedures for project control and record-keeping become indispensable tools to managers and other participants in the construction process. These tools serve the dual purpose of recording the financial transactions that occur as well as giving managers an indication of the progress and problems associated with a project. The problems of project control are aptly summed up in an old definition of a project as "any collection of vaguely related activities that are ninety percent complete, over budget, and late." The task of project control systems is to give a fair indication of the existence and the extent of such problems.
In this section, we will consider the problems associated with resource utilization, accounting, monitoring, and control during a project. In this discussion, we emphasize the project management uses of accounting information. Interpretation of project accounts is generally not straightforward until a project is completed, and then it is too late to influence project management. Even after the completion of a project, the accounting results may be confusing. Hence, managers need to know how to interpret accounting information for project management. In the process of considering management problems, however, we shall discuss some of the common accounting systems and conventions, although our purpose is not to provide a comprehensive survey of accounting procedures.
The limited objective of project control deserves emphasis. Project control procedures are primarily intended to identify deviations from the project plan rather than to suggest possible areas for cost savings. This characteristic reflects the advanced stage at which project control becomes important. The time at which major cost savings can be achieved is during the planning and design of the project. During the actual construction, changes are likely to delay the project and lead to inordinate cost increases. As a result, the focus of project control is on fulfilling the original design plans or indicating deviations from these plans, rather than on searching for significant improvements and cost savings. It is only when a rescue operation is required that major changes will normally occur in the construction plan.
Finally, the issues associated with integration of information will require some discussion. Project management activities and functional concerns are intimately linked, yet the techniques used in many instances do not facilitate comprehensive or integrated consideration of project activities. For example, schedule information and cost accounts are usually kept separately. As a result, project managers themselves must synthesize a comprehensive view from the different reports on the project plus their field observations. In particular, managers are often forced to infer the cost impacts of schedule changes, rather than being provided with aids for this process. Communication or integration of various types of information can serve many useful purposes, although it does require special attention in the establishment of project control procedures.
The Project Budget
For cost control on a project, the construction plan and the associated cash flow estimates can provide the baseline reference for subsequent project monitoring and control. For schedules, progress on individual activities and the achievement of milestone completions can be compared with the project schedule to monitor the progress of activities. Contract and job specifications provide the criteria by which to assess and assure the required quality of construction. The final or detailed cost estimate provides a baseline for the assessment of financial performance during the project. To the extent that costs are within the detailed cost estimate, then the project is thought to be under financial control. Overruns in particular cost categories signal the possibility of problems and indicate exactly what problems are being encountered. Expense-oriented construction planning and control focuses on the categories included in the final cost estimation. This focus is particularly relevant for projects with few activities and considerable repetition such as grading and paving roadways.
For control and monitoring purposes, the original detailed cost estimate is typically converted to a project budget, and the project budget is used subsequently as a guide for management. Specific items in the detailed cost estimate become job cost elements. Expenses incurred during a project are recorded in specific job cost accounts to be compared with the original cost estimates in each category. Consequently, individual job cost accounts generally represent the basic unit for cost control. Alternatively, job cost accounts may be disaggregated or divided into work elements that are related both to particular scheduled activities and to particular cost accounts.
In addition to cost amounts, information on material quantities and labor inputs within each job account is also typically retained in the project budget. With this information, actual materials usage and labor employed can be compared to the expected requirements. As a result, cost overruns or savings on particular items can be identified as due to changes in unit prices, labor productivity, or the amount of material consumed.
The number of cost accounts associated with a particular project can vary considerably. For constructors, on the order of four hundred separate cost accounts might be used on a small project. These accounts record all the transactions associated with a project. Thus, separate accounts might exist for different types of materials, equipment use, payroll, project office, etc. Both physical and non-physical resources are represented, including overhead items such as computer use or interest charges.
In developing or implementing a system of cost accounts, an appropriate numbering or coding system is essential to facilitate the communication of information and proper aggregation of cost information. Particular cost accounts are used to indicate the expenditures associated with specific projects and to indicate the expenditures on particular items throughout an organization. These are examples of different perspectives on the same information, in which the same information may be summarized in different ways for specific purposes. Thus, more than one aggregation of the cost information and more than one application program can use a particular cost account. Separate identifiers of the type of cost account and the specific project must be provided for project cost accounts or financial transactions. As a result, a standard set of cost codes such as the MasterFormat codes may be adopted to identify cost accounts along with project identifiers and extensions to indicate organization or job-specific needs. Similarly the use of databases or, at a minimum, inter-communicating applications programs facilitate access to cost information.
Converting a final cost estimate into a project budget compatible with an organization's cost accounts is not always a straightforward task. Cost estimates are generally disaggregated into appropriate functional or resource-based project categories. For example, labor and material quantities might be included for each of several physical components of a project. For cost accounting purposes, labor and material quantities are aggregated by type no matter for which physical component they are employed. For example, particular types of workers or materials might be used on numerous different physical components of a facility. Moreover, the categories of cost accounts established within an organization may bear little resemblance to the quantities included in a final cost estimate. This is particularly true when final cost estimates are prepared by an external reporting requirement rather than given the existing cost accounts within an organization.
One particular problem in forming a project budget in terms of cost accounts is the treatment of contingency amounts. These allowances are included in project cost estimates to accommodate unforeseen events and the resulting costs. However, in advance of project completion, the source of contingency expenses is not known. Realistically, a budget accounting item for contingency allowance should be established whenever a contingency amount is included in the final cost estimate.
A second problem in forming a project budget is the treatment of inflation. Typically, final cost estimates are formed in terms of real dollars and an item reflecting inflation costs is added on as a percentage or lump sum. This inflation allowance would then be allocated to individual cost items in relation to the actual expected inflation over the period for which costs will be incurred.
Activity 5.1: "It's Out of Control!"
Overview
During the Execution phase, we are constantly monitoring our project to ensure it is staying within the parameters set during the Planning phase. This is known to some as the Monitoring and Controlling phase of our project. In this assignment, we are going to practice some techniques to determine if our project is staying on course, and if we need to make course corrections.
Instructions
Respond to the following two questions, each concerning either the project's schedule or budget. Analyze the given data and apply your knowledge of monitoring and controlling to assess if the project is progressing as planned or facing delays, and whether it is within the allocated budget or exceeding costs. Based on your evaluation, suggest strategies to realign the project with its intended schedule and budgetary constraints.
Use the following information to answer the questions:
|
Project Schedule and Budget |
|||
| Activity | Budgeted Cost | Total Work | Planned Completion by End of Week |
| Exterior Concrete Work | $40,000 | 20 cubic yards | 10 cubic yards |
| Interior Carpet | $15,000 | 10,000 square feet | 5,000 square feet |
| Painting | $10,000 | 20,000 square feet | 13,000 square feet |
Question
- Your superintendent provides you with your end-of-week report. Within, she details the completion status of several of your concurrent activities.
- “The exterior concrete work has successfully poured 8 cubic yards. The interior carpet has been completed for the main area, but none of the smaller offices, so it is only about 3,500 square feet. The painting completed all the smaller offices so as not to overlap with the carpet. They completed 13,000 square feet of painting. “
- Your accounts payable department provides you with an invoice report. Within, it details what invoices have come in and for what amounts.
- “The invoice for the exterior concrete work came in at $15,000. The flooring vendor submitted an invoice for $6,000. The painting vendor submitted for $6,500.”
Evaluation
Your assignment will be assessed based on the following criteria:
- Correct Identification of Issue: Accuracy in determining whether each project activity is ahead or behind schedule and budget.
- Recommended Corrective Actions: Practicality and effectiveness of the feedback provided to address identified issues.
Forecasting for Activity Cost Control
For project management and control, it is not sufficient to consider only the record of costs and revenues incurred in a project. Good managers should focus on future revenues, future costs, and technical problems. For this purpose, traditional financial accounting schemes are not adequate to reflect the dynamic nature of a project. Accounts typically focus on recording routine costs and past expenditures associated with activities. Generally, past expenditures represent sunk costs that cannot be altered in the future and may or may not be relevant in the future. For example, after the completion of some activity, it may be discovered that some quality flaw renders the work useless. Unfortunately, the resources expended on the flawed construction will generally be sunk and cannot be recovered for re-construction (although it may be possible to change the burden of who pays for these resources by financial withholding or charges; owners will typically attempt to have constructors or designers pay for changes due to quality flaws). Since financial accounts are historical, some means of forecasting or projecting the future course of a project is essential for management control. In this section, some methods for cost control and simple forecasts are described.
An example of forecasting used to assess the project status is shown in Table 5.1. In this example, costs are reported in five categories, representing the sum of all the various cost accounts associated with each category:
Budgeted Cost
The budgeted cost is derived from the detailed cost estimate prepared at the start of the project. The factors of cost would be referenced by cost account and by a prose description.
Estimated Total Cost
The estimated or forecast total cost in each category is the current best estimate of costs based on progress and any changes since the budget was formed. Estimated total costs are the sum of the cost to date, commitments, and exposure. Methods for estimating total costs are described below.
Cost Committed and Cost Exposure
The estimated cost to completion in each category is divided into firm commitments and estimated additional cost or exposure. Commitments may represent material orders or subcontracts for which firm dollar amounts have been committed.
Cost to Date
The actual cost incurred to date is recorded in column 6 and can be derived from the financial record-keeping accounts.
Over or (Under)
The final column in Table 5.1 indicates the amount over or under the budget for each category. This column is an indicator of the extent of variance from the project budget; items with unusually large overruns would represent a particular managerial concern. Note that variance is used in the terminology of project control to indicate a difference between budgeted and actual expenditures. The term is defined and used quite differently in statistics or mathematical analysis. In Table 5.1, labor costs are running higher than expected, whereas subcontracts are less than expected.
The current status of the project is a forecast budget overrun of $5,950. with 23 percent of the budgeted project costs incurred to date.
|
TABLE 5.1: Illustration of a Job Status Report |
||||||
| Factor | Budgeted Cost | Estimated Total Cost | Cost Committed | Cost Exposure | Cost To Date | Over or (Under) |
| Labor | 99,406 | 102,342 | 49,596 | - | 52,746 | - |
| Material | 88,499 | 88,499 | 42,506 | 45,993 | - | 2,936 |
| Subcontracts | 198,458 | 196,323 | 83,352 | 97,832 | 15,139 | (2,135) |
| Equipment | 37,543 | 37,543 | 23,623 | - | 13,920 | 0 |
| Other | 72,693 | 81,432 | 49,356 | - | 32,076 | 8,739 |
| Total | 496,509 | 506,139 | 248,433 | 143,825 | 113,881 | 5,950 |
For project control, managers would focus particular attention on items indicating substantial deviation from budgeted amounts. In particular, the cost overruns in the labor and in the "other expense category would be worthy of attention by a project manager in Table 5.1. A next step would be to look in greater detail at the various components of these categories. Overruns in cost might be due to lower-than-expected productivity, higher-than-expected wage rates, higher-than-expected material costs, or other factors. Even further, low productivity might be caused by inadequate training, lack of required resources such as equipment or tools, or inordinate amounts of re-work to correct quality problems. Review of a job status report is only the first step in project control.
The job status report illustrated in Table 5.1 employs explicit estimates of ultimate cost in each category of expense. These estimates are used to identify the actual progress and status of a expense category. Estimates might be made from simple linear extrapolations of the productivity or cost of the work to date on each project item.
Simplifying Project Control and Cost Estimation
Project control involves closely monitoring your budget and paying special attention to any significant deviations from what was planned. If labor costs or other expenses start to exceed the budget, it's a signal for managers to dig deeper. These overruns could be due to various factors like unexpected wage increases, high material costs, or low productivity, among others. For instance, low productivity could stem from insufficient training, lack of tools, or excessive rework due to quality issues. The first step in addressing these issues is analyzing the job status report.
Job Status Report Analysis
The job status report helps managers see where the money is going and compare it to the planned budget. It breaks down expenses into categories and estimates the final cost for each based on the work done so far. Two main methods can be used for this estimation:
- Linear Extrapolation: This method predicts the total cost by looking at how much of the work has been completed and the costs incurred up to that point. For example, if half the work has cost $40,000, the total project might end up costing around $80,000.
- Unit Cost Forecasting: Here, the prediction is based on the average cost per unit of work. If the average cost is $50 per unit and 1,600 units need to be done, the total expected cost would be $80,000.
Further adjustments can be made to these estimates to account for changes in productivity or costs that might occur as the project progresses.
Improving Estimates
Project managers might adjust the basic estimating formulas to reflect real-world conditions better. For example, if workers are getting faster and more efficient, reducing the unit cost of work, the estimates for total costs might go down. Similarly, if new information suggests that material costs or labor rates will change, these can be factored into future expense estimates.
Tracking Work Progress
Several methods exist for measuring how much of the project has been completed:
- Units of Work Completed: This method involves measuring the actual amount of work done, like the length of piping installed.
- Incremental Milestones: Breaking down the project into milestones can help estimate progress. For example, different stages in piping installation can signal varying degrees of completion.
- Opinion: Sometimes, the progress estimate is based on the judgment of inspectors or project managers, though this can be subjective.
- Cost Ratio: This method looks at the costs incurred so far versus the total budgeted costs to estimate completion percentage. However, it doesn't independently verify how much work has been done.
By applying these estimation techniques systematically across project activities, managers can get a clearer picture of progress and update job status reports accordingly. In some cases, technology like transponders can automatically track and update work progress in a central database, offering real-time insights into the project's status.
Example 5.3: Estimated Total Cost to Complete an Activity
Suppose that we wish to estimate the total cost to complete piping construction activities on a project. The piping construction involves 1,000 linear feet of piping which has been divided into 50 sections for management convenience. At this time, 400 linear feet of piping have been installed at a cost of $40,000 and 500 man-hours of labor. The original budget estimate was $90,000 with a productivity of one foot per man-hour, a unit cost of $60 per man-hour and a total material cost of $ 30,000. Firm commitments of material delivery for the $30,000 estimated cost have been received.
The first task is to estimate the proportion of work completed. Two estimates are readily available. First, 400 linear feet of pipe are in place out of a total of 1000 linear feet, so the proportion of work completed is 400/1000 = 0.4 or 40%. This is the "units of work completed" estimation method. Second, the cost ratio method would estimate the work completed as the cost-to-date divided by the cost estimate of $40,000/$ 90,000 = 0.44 or 44%. Third, the "incremental milestones" method would be applied by examining each pipe section estimating a percentage complete and then aggregating to determine the total percentage complete. For example, suppose the following quantities of piping fell into four categories of completeness:
- complete (100%) = 380 ft
- hangars and trim complete (90%) = 20 ft
- ends welded (60%) = 5 ft
- spool in place (20%) = 0 ft
Then using the incremental milestones shown above, the estimate of completed work would be 380 + (20)(0.9) + (5)(0.6) + 0 = 401 ft and the proportion complete would be 401 ft/1,000 ft = 0.401 or 40% after rounding.
Once an estimate of work completed is available, then the estimated cost to complete the activity can be calculated. First, a simple linear extrapolation of cost results in an estimate of $40,000/0.4 = $100,000. for the piping construction using the 40% estimate of work completed. This estimate projects a cost overrun of 100,000 - 90,000 = $10,000.
Second, a linear extrapolation of productivity results in an estimate of (1000 ft.)(500 hrs./400 ft.)($60/hr.) + 30,000 = $105,000. for completion of the piping construction. This estimate suggests a variance of 105,000 - 90,000 = $15,000 above the activity estimate. In making this estimate, labor and material costs were entered separately, whereas the two were implicitly combined in the simple linear cost forecast above.
The source of the variance can also be identified in this calculation:
- When compared to the original estimate, the labor productivity is 1.25 hours per foot or 25% higher than the original estimate.
Example 5.4: Estimated Total Cost for Completion
The forecasting procedures described above assumed linear extrapolations of future costs, based either on the complete experience of the activity or the recent experience. For activities with good historical records, it can be the case that a typically non-linear profile of cost expenditures and completion proportions can be estimated. Figure 5.2 illustrates one possible non-linear relationship derived from experience in some particular activity. The progress on a new job can be compared to this historical record. For example, point A in Figure 5.2 suggests a higher expenditure than is normal for the completion proportion. This point represents 40% of the work completed with an expenditure of 60% of the budget. Since the historical record suggests only 50% of the budget should be expended at the time of 40% completion, a 60 - 50 = 10% overrun in cost is expected even if work efficiency can be increased to historical averages. If comparable cost overruns continue to accumulate, then the cost-to-complete will be even higher.
Control of Project Cash Flows
Forecasting for Activity Cost Control describes the development of information for the control of project costs concerning the various functional activities appearing in the project budget. Project managers also are involved with the assessment of the overall status of the project, including the status of activities, financing, payments and receipts. These various items comprise the project and financing cash flows described in earlier chapters. These components include costs incurred (as described above), billings and receipts for billings to owners (for contractors), payable amounts to suppliers and contractors, financing plan cash flows (for bonds or other financial instruments), etc.
As an example of cash flow control, consider the report shown in Table 5.2. In this case, costs are not divided into functional categories as in Table 5.1, such as labor, material, or equipment. Table 5.2 represents a summary of the project status as viewed from different components of the accounting system. The elements in Table 5.2 include:
- Costs
This is a summary of charges as reflected by the job cost accounts, including expenditures and estimated costs. This row provides an aggregate summary of the detailed activity cost information described in the previous section. For this example, the total costs as of July 2 (7/02) were $ 8,754,516, and the original cost estimate was $65,863,092, so the approximate percentage complete was 8,754,516/65,863,092 or 13.292%. However, the project manager now projects a cost of $66,545,263 for the project, representing an increase of $682,171 over the original estimate. This new estimate would reflect the actual percentage of work completed as well as other effects such as changes in unit prices for labor or materials. Needless to say, this increase in expected costs is not a welcome change for the project manager. - Billings
This row summarizes the state of cash flows concerning the owner of the facility; this row would not be included in reports to owners. The contract amount was $67,511,602, and a total of $9,276,621 or 13.741% of the contract has been billed. The amount of allowable billing is specified under the terms of the contract between an owner and an engineer, architect, or constructor. In this case, total billings have exceeded the estimated project completion proportion. The final column includes the currently projected net earnings of $966,339. This figure is calculated as the contract amount less projected costs: 67,511,602 - 66,545,263 = $966,339. Note that this profit figure does not reflect the time value of money or discounting. - Payables
The Payables row summarizes the amount owed by the contractor to material suppliers, labor or sub-contractors. At the time of this report, $6,719,103 had been paid to subcontractors, material suppliers, and others. Invoices of $1,300,089 have accumulated but have not yet been paid. A retention of $391,671 has been imposed on subcontractors, and $343,653 in direct labor expenses have occurred. The total of payables is equal to the total project expenses shown in the first row of costs. - Receivables
This row summarizes the cash flow of receipts from the owner. Note that the actual receipts from the owner may differ from the amounts billed due to delayed payments or retainage on the part of the owner. The net bill equals the gross billed less retention by the owner. In this case, the gross billed is $9,276,621 (as shown in the billings row), the net billed is $8,761,673 and the retention is $514,948. Unfortunately, only $7,209,344 has been received from the owner, so the open receivable amount is a (substantial!) $2,067,277 due from the owner. - Cash Position
This row summarizes the cash position of the project as if all expenses and receipts for the project were combined in a single account. The actual expenditures have been $7,062,756 (calculated as the total costs of $8,754,516 fewer subcontractor retentions of $391,671 and unpaid bills of $1,300,089) and $ 7,209,344 have been received from the owner. As a result, a net cash balance of $146,588 exists which can be used in an interest-earning bank account or to finance deficits on other projects.
Each of the rows shown in Table 5.2 would be derived from different sets of financial accounts. Additional reports could be prepared on the financing cash flows for bonds or interest charges in an overdraft account.
| TABLE 5.2 An Example of a Cash Flow Status Report | |||||
| Costs
7/02 |
Charges
8,754,516 |
Estimated
65,863,092 |
% Complete
13.292 |
Projected
66,545,263 |
Change
682,171 |
| Billings
7/01 |
Contract
67,511,602 |
Gross Bill
9,276,621 |
% Billed
13.741 |
Profit
966,339 |
|
| Payables
7/01 |
Paid
6,719,103 |
Open
1,300,089 |
Retention
391,671 |
Labor
343,653 |
Total
8,754,516 |
| Receivable
7/02 |
Net Bill
8,761,673 |
Received
7,209,344 |
Retention
514,948 |
Open
2,067,277 |
|
| Cash Position | Paid
7,062,756 |
Received
7,209,344 |
Position
146,588 |
||
The overall status of the project requires synthesizing the different pieces of information summarized in Table 5.2. Each of the different accounting systems contributing to this table provides a different view of the status of the project. In this example, the budget information indicates that costs are higher than expected, which could be troubling. However, a profit is still expected for the project. A substantial amount of money is due from the owner, and this could turn out to be a problem if the owner continues to lag in payment. Finally, the positive cash position for the project is highly desirable since financing charges can be avoided.
The job status reports illustrated in this and the previous sections provide a primary tool for project cost control. Different reports with varying amounts of detail and item reports would be prepared for different individuals involved in a project. Reports to upper management would be summaries, reports to particular staff individuals would emphasize their responsibilities (eg. purchasing, payroll, etc.), and detailed reports would be provided to the individual project managers. Coupled with scheduling reports described in Chapter 10, these reports provide a snapshot view of how a project is doing. Of course, these schedule and cost reports would have to be tempered by the actual accomplishments and problems occurring in the field. For example, if work already completed is of sub-standard quality, these reports would not reveal such a problem. Even though the reports indicated a project on time and on budget, the possibility of re-work or inadequate facility performance due to quality problems would quickly reverse that rosy situation.
Schedule Control
In addition to cost control, project managers must also give considerable attention to monitoring schedules. Construction typically involves a deadline for work completion, so contractual agreements will force attention to schedules. More generally, delays in construction represent additional costs due to late facility occupancy or other factors. Just as costs incurred are compared to budgeted costs, actual activity durations may be compared to expected durations. In this process, forecasting the time to complete particular activities may be required.
The methods used for forecasting completion times of activities are directly analogous to those used for cost forecasting. For example, a typical estimating formula might be:
Where is the forecast duration, W is the amount of work and is the observed productivity to time t. As with cost control, it is important to devise efficient and cost-effective methods for gathering information on actual project accomplishments. Generally, observations of work completed are made by inspectors and project managers and then work completed is estimated. Once estimates of work complete and time expended on particular activities are available, deviations from the original duration estimate can be estimated.
For example, Figure 5.3 shows the originally scheduled project progress versus the actual progress on a project. This figure is constructed by summing up the percentage of each activity which is completed at different points in time; this summation can be weighted by the magnitude of effort associated with each activity. In Figure 5.3, the project was ahead of the original schedule for a period including point A but is now late at point B by an amount equal to the horizontal distance between the planned progress and the actual progress observed to date.
Schedule adherence and the current status of a project can also be represented on geometric models of a facility. For example, an animation of the construction sequence can be shown on a computer screen, with different colors or other coding schemes indicating the type of activity underway on each component of the facility. Deviations from the planned schedule can also be portrayed by color coding. The result is a mechanism to both indicate work in progress and schedule adherence specific to individual components in the facility.
In evaluating schedule progress, it is important to bear in mind that some activities possess float or scheduling leeway, whereas delays in activities on the critical path will cause project delays. In particular, the delay in planned progress at time t may be soaked up in activities' float (thereby causing no overall delay in the project completion) or may cause a project delay. As a result of this ambiguity, it is preferable to update the project schedule to devise an accurate portrayal of the schedule adherence. After applying a scheduling algorithm, a new project schedule can be obtained. For cash flow planning purposes, a graph or report similar to that shown in Figure 5.4 can be constructed to compare actual expenditures to planned expenditures at any time. This process of rescheduling to indicate schedule adherence is only one of many instances in which schedule and budget updating may be appropriate, as discussed in the next section.
Schedule and Budget Updates
Scheduling and project planning is an activity that continues throughout the lifetime of a project. As changes or discrepancies between the plan and the realization occur, the project schedule and cost estimates should be modified and new schedules devised. Too often, the schedule is devised once by a planner in the central office, and then revisions or modifications are done incompletely or only sporadically. The result is the lack of effective project monitoring and the possibility of eventual chaos on the project site.
On "fast track" projects, initial construction activities are begun even before the facility design is finalized. In this case, special attention must be placed on the coordinated scheduling of design and construction activities. Even in projects for which the design is finalized before construction begins, change orders representing changes in the "final" design are often issued to incorporate changes desired by the owner.
Periodic updating of future activity durations and budgets is especially important to avoid excessive optimism in projects experiencing problems. If one type of activity experiences delays on a project, then related activities are also likely to be delayed unless managerial changes are made. Construction projects normally involve numerous activities which are closely related due to the use of similar materials, equipment, workers or site characteristics. Expected cost changes should also be propagated throughout a project plan. In essence, duration and cost estimates for future activities should be revised in light of the experience on the job. Without this updating, project schedules slip more and more as time progresses. To perform this type of updating, project managers need access to original estimates and estimating assumptions.
Unfortunately, most project cost control and scheduling systems do not provide many aids for such updating. What is required is a means of identifying discrepancies, diagnosing the cause, forecasting the effect, and propagating this effect to all related activities. While these steps can be undertaken manually, computer aids to support interactive updating or even automatic updating would be helpful. Beyond the direct updating of activity durations and cost estimates, project managers should have mechanisms available for evaluating any type of schedule change. Updating activity duration estimations, changing scheduled start times, modifying the estimates of resources required for each activity, and even changing the project network logic (by inserting new activities or other changes) should all be easily accomplished. In effect, scheduling aids should be directly available to project managers. Fortunately, local computers are commonly available on-site for this purpose.
Example 5.5: Schedule Updates in a Small Project. As an example of the type of changes that might be required, consider the nine-activity project example appearing in Figure 5.5. Also, suppose that the project is four days underway, with the current activity schedule and progress as shown in Figure 5.6.

A few problems or changes that might be encountered include the following:
- Rupture of an Unknown Underground Waterline:
An underground waterline rupture on the fifth day requires additional time for repair and cleanup, affecting the project duration. To address this, the project manager has two options:
- Extend the duration of Activity C, General Excavation, to 10 days.
- Split Activity C into two parts (before and after the waterline break) and introduce a new activity for the repair and cleanup. This method allows for an accurate representation of the impact on the schedule, including any delays to subsequent activities.
Action Required: Opting to extend Activity C's duration to 10 days directly impacts the project since Activity C is on the critical path, leading to a two-day extension in project duration.
- Installation Request for an Additional Drain:
After 8 days on the project, the owner asks that a new drain be installed in addition to the sewer line scheduled for Activity G. The project manager determines that a new activity could be added to install the drain in parallel with Activity G requiring 2 days. Effect on Schedule:
- Inserting a new activity in the project network between nodes 3 and 4 violates the activity-on-branch convention that only one activity can be defined between any two nodes. Hence, a new node and a dummy activity must be inserted in addition to the drain installation activity. As a result, the nodes must be re-numbered and the critical path schedule developed again. Performing these operations reveals that no change in the project duration would occur and the new activity has a total float of 1 day.
- To avoid the labor associated with modifying the network and renumbering nodes, suppose that the project manager simply re-defined activity G as the installation of sewer and drain lines requiring 4 days. In this case, activity G would appear on the critical path and the project duration would increase. Adding an additional crew so that the two installations could proceed in parallel might reduce the duration of activity G back to 2 days and thereby avoid the increase in the project duration.
- Collapse of Excavated Trenches During Activity E:
On day 12 of the project, the excavated trenches collapsed during Activity E. An additional 5 days will be required for this activity.
Effect on Schedule: Activity E has a total float of only 1 day. With the change in this activity's duration, it will lie on the critical path and the project duration will increase.
Action Required: Analysis of possible time savings in subsequent activities is now required.
It is not at all uncommon to encounter changes during a project that requires modification of durations, changes in the network logic of precedence relationships, or additions and deletions of activities. Consequently, the scheduling process should be readily available as the project is underway.
Relating Cost and Schedule Information
The previous sections focused on the identification of the budgetary and schedule status of projects. Actual projects involve a complex inter-relationship between time and cost. As projects proceed, delays influence costs and budgetary problems may in turn require adjustments to activity schedules. Trade-offs between time and costs were discussed in Section 10.9 in the context of project planning in which additional resources applied to a project activity might result in a shorter duration but higher costs. Unanticipated events might result in increases in both time and cost to complete an activity. For example, excavation problems may easily lead to much lower than anticipated productivity on activities requiring digging.
While project managers implicitly recognize the interplay between time and cost on projects, it is rare to find effective project control systems which include both elements. Usually, project costs and schedules are recorded and reported by separate application programs. Project managers must then perform the tedious task of relating the two sets of information.
The difficulty of integrating schedule and cost information stems primarily from the level of detail required for effective integration. Usually, a single project activity will involve numerous cost account categories. For example, an activity for the preparation of a foundation would involve laborers, cement workers, concrete forms, concrete, reinforcement, transportation of materials and other resources. Even a more disaggregated activity definition such as the erection of foundation forms would involve numerous resources such as forms, nails, carpenters, laborers, and material transportation. Again, different cost accounts would normally be used to record these various resources. Similarly, numerous activities might involve expenses associated with particular cost accounts. For example, a particular material such as standard piping might be used in numerous different scheduled activities. To integrate cost and schedule information, the disaggregated charges for specific activities and specific cost accounts must be the basis of analysis.
A straightforward means of relating time and cost information is to define individual work elements representing the resources in a particular cost category associated with a particular project activity. Work elements would represent an element in a two-dimensional matrix of activities and cost accounts as illustrated in Figure 5.7. A numbering or identifying system for work elements would include both the relevant cost account and the associated activity. In some cases, it might also be desirable to identify work elements by the responsible organization or individual. In this case, a three-dimensional representation of work elements is required, with the third dimension corresponding to responsible individuals.
More generally, modern computerized databases can accommodate a flexible structure of data representation to support aggregation concerning numerous different perspectives.
With this organization of information, several management reports or views could be generated. In particular, the costs associated with specific activities could be obtained as the sum of the work elements appearing in any row in Table 5.3. These costs could be used to evaluate alternate technologies to accomplish particular activities or to derive the expected project cash flow over time as the schedule changes. From a management perspective, problems developing from particular activities could be rapidly identified since costs would be accumulated at such a disaggregated level. As a result, project control becomes at once more precise and detailed.
| TABLE 5.3: Illustration of a Cost Account and Project Activity Matrix | ||||||
| Project Activity Group | 204.1 | 204.2 | 204.3 | 204.4 | 204.5 | 204.6 |
| First Floor | X | X | - | X | - | X |
| Second Floor | - | X | - | X | - | X |
| Third Floor | - | X | X | X | - | X |
| Fourth Floor | - | X | X | - | - | X |
| Fifth Floor | - | X | X | - | X | X |
Unfortunately, the development and maintenance of a work element database can represent a large data collection and organization effort. As noted earlier, four hundred separate cost accounts and four hundred activities would not be unusual for a construction project. The result would be up to 400 x 400 = 160,000 separate work elements. Of course, not all activities involve each cost account. However, even a density of two percent (so that each activity would have eight cost accounts and each account would have eight associated activities on average) would involve nearly thirteen thousand work elements. Initially preparing this database represents a considerable burden, but it is also the case that project bookkeepers must record project events within each of these various work elements. Implementations of the "work element" project control systems have typically foundered on the burden of data collection, storage, and bookkeeping.
Until data collection is better automated, the use of work elements to control activities in large projects is likely to be difficult to implement. However, certain segments of project activities can profit tremendously from this type of organization. In particular, material requirements can be tracked in this fashion. Materials involve only a subset of all cost accounts and project activities, so the burden of data collection and control is much smaller than for an entire system. Moreover, the benefits from the integration of schedule and cost information are particularly noticeable in materials control since delivery schedules are directly affected and bulk order discounts might be identified. Consequently, materials control systems can reasonably encompass a "work element" accounting system.
In the absence of a work element accounting system, costs associated with particular activities are usually estimated by summing expenses in all cost accounts directly related to an activity plus a proportion of expenses in cost accounts used jointly by two or more activities. The basis of cost allocation would typically be the level of effort or resources required by the different activities. For example, costs associated with supervision might be allocated to different concreting activities based on the amount of work (measured in cubic yards of concrete) in the different activities. With these allocations, cost estimates for particular work activities can be obtained.
Engaging with Industry Experts 5.1
Overview
Dive into the dynamics of project change control with two videos by project management expert Mike Clayton. In "Change Control: Your Guide to Project Change Control," Clayton unpacks the essentials of navigating changes in projects, emphasizing the need for control through documentation like the Change Request Document and Change Log. Following this, "How to Manage the Change Control Process" provides a detailed six-step method for handling change requests, extending beyond standard project management documentation to include crucial steps of implementation and review. These videos offer a comprehensive overview of managing project changes effectively, from stakeholder requests to agile project adjustments.
Reflection
Once you've watched the videos, take a moment to reflect on the new information and perspectives shared. To guide your reflection, consider the following questions:
- Learning Takeaways: What is one new piece of information you learned from Mike Clayton's insights? How does it add to your understanding of the construction industry?
- Connection to Class Topics: Did the videos help clarify any of the topics we're covering in class? Describe any connections or insights you've made.
- Curiosity and Questions: Were there any questions you wished to ask Mike Clayton while watching the videos? If so, were these questions addressed in the content?
- Looking Forward: Based on what you've learned, what is one question you would like to explore further?
Evaluation Criteria
Your responses will be evaluated based on the completeness of your answers and the depth of your reflections. Aim to provide thoughtful and detailed responses, with each answer comprising at least one well-developed paragraph. Your complete reflection should not exceed two pages.
This exercise is not only about what you've learned from the videos but also about how you integrate this new knowledge with our classroom discussions and your personal curiosity about the construction industry.
Module 5 Recap
Applying the Knowledge
Throughout this module's lessons, learning activities, and reflections, you have been equipped to:
- Effectively transition projects from the planning phase to execution while maintaining alignment with the project's objectives.
- Utilize tools and techniques for monitoring project progress and making necessary adjustments to keep on schedule and within budget.
- Enhance safety protocols and quality controls to mitigate risks and ensure project success.
Looking Forward
As we continue, reflect on how the principles and practices of effective project execution, monitoring, and controlling can be applied to your upcoming projects. Consider the integration of these strategies into your project management toolkit to enhance both project outcomes and team safety.
Reflection and Engagement:
- Reflect on how your understanding of the execution and monitoring phases has deepened. How do you perceive their impact on the overall project success?
- What strategies from this module do you find most relevant for managing future projects, particularly in ensuring safety and adherence to project timelines and budgets?
Let's use the insights gained in this module to enhance our approach to managing complex construction projects, ensuring they are completed safely, on time, and within budget.
Module Five Quiz
Wor
1. This level of construction begins after the building envelope has been sealed.
a. Exterior construction
b. MEP
c. Finishes and fixtures
d. Rough framing
2. In this level of execution, the ground is prepped to ensure the foundation will be stable for the success of the build.
a. Rough framing
b. Pre-Construction
c. Exterior construction
d. Sitework
3. True or False: Project execution occurs simultaneously with monitoring and controlling.
a. True
b. False
4. The highest cause of construction worker deaths is which of the "fatal four"?
a. Falls
b. Struck by object
c. Caught-in/between
d. Electrocutions
5. A communication plan includes the following elements:
a. Frequency of communication
b. Medium of communication
c. Level of information
d. All of these
6. The budgeted cost of the completed work as of a certain date in the project is known as the:
a. Earned value
b. Planned value
c. Budget at completion
d. Actual cost
7. True or False: The majority of traumatic construction deaths are preventable.
a. True
b. False
8. True or False: Project execution is where the actual production of deliverables occurs.
a. True
b. False
9. True or False: The construction industry has the best safety record of any industry.
a. True
b. False
10. During the executing phase, what things would warrant activation of the change control process?
a. Schedule
b. Scope
c. Process
d. All of these
Works Cited
- Material Adapted - Hendrickson, C., Hendrickson, C. T., & Au, T. (2008). Project Management for Construction: Fundamental Concepts for Owners, Engineers, Architects, and Builders. Chris Hendrickson. The license allows reproduction for educational purposes with citation.
- Reese, C.D., & Eidson, J.V. (2006). Handbook of OSHA Construction Safety and Health (2nd ed.). CRC Press. Taylor Francis Books.
- Carnegie Mellon University. (n.d.). Quality Control and Safety During Construction. Retrieved from https://www.cmu.edu/cee/projects/PMbook/13_Quality_Control_and_Safety_During_Construction.html#fn4
- Online PM Courses - Mike Clayton. (2024, March 27). Change Control 101 - Your Guide to Project Change Control [Video]. YouTube. https://youtu.be/EfMVASdStpw
- Online PM Courses - Mike Clayton. (2023, June 14). How to Manage the Change Control Process [Video]. YouTube. https://youtu.be/pTtqmy6gD_M
